Bank of America 2011 Annual Report Download - page 32
Download and view the complete annual report
Please find page 32 of the 2011 Bank of America annual report below. You can navigate through the pages in the report by either clicking on the pages listed below, or by using the keyword search tool below to find specific information within the annual report.-
 1
1 -
2
-
3
-
4
-
5
-
6
-
7
-
8
-
9
-
10
-
11
-
12
-
13
-
14
-
15
-
16
-
17
-
18
-
19
-
20
-
21
-
 22
22 -
 23
23 -
 24
24 -
 25
25 -
 26
26 -
 27
27 -
 28
28 -
 29
29 -
 30
30 -
 31
31 -
 32
32 -
 33
33 -
 34
34 -
 35
35 -
 36
36 -
 37
37 -
 38
38 -
 39
39 -
 40
40 -
 41
41 -
 42
42 -
43
-
44
-
45
-
46
-
47
-
48
-
49
-
50
-
51
-
52
-
53
-
54
-
55
-
56
-
57
-
58
-
59
-
60
-
61
-
62
-
63
-
64
-
65
-
66
-
67
-
68
-
69
-
70
-
71
-
72
-
73
-
74
-
75
-
76
-
77
-
78
-
79
-
80
-
81
-
82
-
83
-
84
-
85
-
86
-
87
-
88
-
89
-
90
-
91
-
92
-
93
-
94
-
95
-
96
-
97
-
98
-
99
-
100
-
101
-
102
-
103
-
104
-
105
-
106
-
107
-
108
-
109
-
110
-
111
-
112
-
113
-
114
-
115
-
116
-
117
-
118
-
119
-
120
-
121
-
122
-
123
-
124
-
125
-
126
-
127
-
128
-
129
-
130
-
131
-
132
-
133
-
134
-
135
-
136
-
137
-
138
-
139
-
140
-
141
-
142
-
143
-
144
-
145
-
146
-
147
-
148
-
149
-
150
-
151
-
152
-
153
-
154
-
155
-
156
-
157
-
158
-
159
-
160
-
161
-
162
-
163
-
164
-
165
-
166
-
167
-
168
-
169
-
170
-
171
-
172
-
173
-
174
-
175
-
176
-
177
-
178
-
179
-
180
-
181
-
182
-
183
-
184
-
185
-
186
-
187
-
188
-
189
-
190
-
191
-
192
-
193
-
194
-
195
-
196
-
197
-
198
-
199
-
200
-
201
-
202
-
203
-
204
-
205
-
206
-
207
-
208
-
209
-
210
-
211
-
212
-
213
-
214
-
215
-
216
-
217
-
218
-
219
-
220
-
221
-
222
-
223
-
224
-
225
-
226
-
227
-
228
-
229
-
230
-
231
-
232
-
233
-
234
-
235
-
236
-
237
-
238
-
239
-
240
-
241
-
242
-
243
-
244
-
245
-
246
-
247
-
248
-
249
-
250
-
251
-
252
-
253
-
254
-
255
-
256
-
257
-
258
-
259
-
260
-
261
-
262
-
263
-
264
-
265
-
266
-
267
-
268
-
269
-
270
-
271
-
272
-
273
-
274
-
275
-
276
 |
 |
30 Bank of America 2011
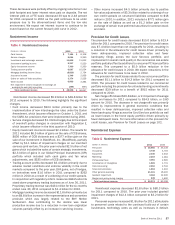
Cash Flows Overview
The Corporation’s operating assets and liabilities support our
global markets and lending activities. We believe that cash flows
from operations, available cash balances and our ability to
generate cash through short- and long-term debt are sufficient to
fund our operating liquidity needs. Our investing activities primarily
include the AFS securities portfolio and other short-term
investments. Our financing activities reflect cash flows primarily
related to increased customer deposits and net long-term debt
repayments.
Cash and cash equivalents increased $11.7 billion during 2011
due to sales of non-core assets and net sales of AFS securities
partially offset by repayment and maturities of certain long-term
debt. Cash and cash equivalents decreased $12.9 billion during
2010 due to repayment and maturities of certain long-term debt
and net purchases of AFS securities partially offset by deposit
growth.
During 2011, net cash provided by operating activities was
$64.5 billion compared to $82.6 billion in 2010. The more
significant adjustments to net income (loss) to arrive at cash
provided by operating activities included the provision for credit
losses, goodwill impairment charges and the net decrease in
trading and derivative instruments.
During 2011, net cash provided by investing activities increased
to $52.4 billion primarily driven by net sales of debt securities.
During 2010, net cash of $30.3 billion was used in investing
activities primarily for net purchases of debt securities.
During 2011 and 2010, the net cash used in financing activities
of $104.7 billion and $65.4 billion primarily reflected the net
decreases in long-term debt as maturities outpaced new
issuances.