Bank of America 2011 Annual Report Download - page 180
Download and view the complete annual report
Please find page 180 of the 2011 Bank of America annual report below. You can navigate through the pages in the report by either clicking on the pages listed below, or by using the keyword search tool below to find specific information within the annual report.-
 1
1 -
2
-
3
-
4
-
5
-
6
-
7
-
8
-
9
-
10
-
11
-
12
-
13
-
14
-
15
-
16
-
17
-
18
-
19
-
20
-
21
-
22
-
23
-
24
-
25
-
26
-
27
-
28
-
29
-
30
-
31
-
32
-
33
-
34
-
35
-
36
-
37
-
38
-
39
-
40
-
41
-
42
-
43
-
44
-
45
-
46
-
47
-
48
-
49
-
50
-
51
-
52
-
53
-
54
-
55
-
56
-
57
-
58
-
59
-
60
-
61
-
62
-
63
-
64
-
65
-
66
-
67
-
68
-
69
-
70
-
71
-
72
-
73
-
74
-
75
-
76
-
77
-
78
-
79
-
80
-
81
-
82
-
83
-
84
-
85
-
86
-
87
-
88
-
89
-
90
-
91
-
92
-
93
-
94
-
95
-
96
-
97
-
98
-
99
-
100
-
101
-
102
-
103
-
104
-
105
-
106
-
107
-
108
-
109
-
110
-
111
-
112
-
113
-
114
-
115
-
116
-
117
-
118
-
119
-
120
-
121
-
122
-
123
-
124
-
125
-
126
-
127
-
128
-
129
-
130
-
131
-
132
-
133
-
134
-
135
-
136
-
137
-
138
-
139
-
140
-
141
-
142
-
143
-
144
-
145
-
146
-
147
-
148
-
149
-
150
-
151
-
152
-
153
-
154
-
155
-
156
-
157
-
158
-
159
-
160
-
161
-
162
-
163
-
164
-
165
-
166
-
167
-
168
-
169
-
 170
170 -
 171
171 -
 172
172 -
 173
173 -
 174
174 -
 175
175 -
 176
176 -
 177
177 -
 178
178 -
 179
179 -
 180
180 -
 181
181 -
 182
182 -
 183
183 -
 184
184 -
 185
185 -
 186
186 -
 187
187 -
 188
188 -
 189
189 -
 190
190 -
191
-
192
-
193
-
194
-
195
-
196
-
197
-
198
-
199
-
200
-
201
-
202
-
203
-
204
-
205
-
206
-
207
-
208
-
209
-
210
-
211
-
212
-
213
-
214
-
215
-
216
-
217
-
218
-
219
-
220
-
221
-
222
-
223
-
224
-
225
-
226
-
227
-
228
-
229
-
230
-
231
-
232
-
233
-
234
-
235
-
236
-
237
-
238
-
239
-
240
-
241
-
242
-
243
-
244
-
245
-
246
-
247
-
248
-
249
-
250
-
251
-
252
-
253
-
254
-
255
-
256
-
257
-
258
-
259
-
260
-
261
-
262
-
263
-
264
-
265
-
266
-
267
-
268
-
269
-
270
-
271
-
272
-
273
-
274
-
275
-
276
 |
 |

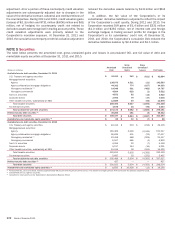
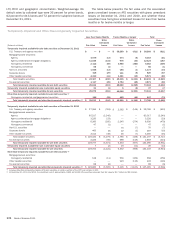
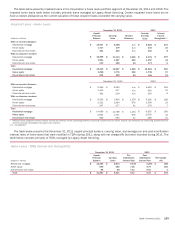
178 Bank of America 2011
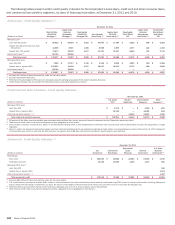
(Dollars in millions)
Home loans
Core portfolio
Residential mortgage (5)
Home equity
Legacy Asset Servicing portfolio
Residential mortgage
Home equity
Discontinued real estate (6)
Credit card and other consumer
U.S. credit card
Non-U.S. credit card
Direct/Indirect consumer (7)
Other consumer (8)
Total consumer
Commercial
U.S. commercial
Commercial real estate (9)
Commercial lease financing
Non-U.S. commercial
U.S. small business commercial
Total commercial loans
Commercial loans accounted for
under the fair value option (10)
Total commercial
Total loans and leases
Percentage of outstandings
December 31, 2010
30-59 Days
Past Due (1)
$ 1,160
186
3,999
1,096
68
1,398
439
1,086
65
9,497
432
250
82
25
189
978
978
$ 10,475
1.11%
60-89 Days
Past Due (1)
$ 236
12
2,879
792
39
1,195
316
522
25
6,016
222
70
18
2
158
470
470
$ 6,486
0.69%
90 Days or
More
Past Due (2)
$ 1,255
105
31,985
2,186
419
3,320
599
1,104
50
41,023
3,689
5,876
135
239
529
10,468
10,468
$ 51,491
5.48%
Total Past
Due 30 Days
or More
$ 2,651
303
38,863
4,074
526
5,913
1,354
2,712
140
56,536
4,343
6,196
235
266
876
11,916
11,916
$ 68,452
7.28%
Total Current
or Less Than
30 Days
Past Due (3)
$ 164,276
71,216
41,591
49,798
930
107,872
26,111
87,596
2,690
552,080
171,241
43,036
21,707
31,722
13,843
281,549
281,549
$ 833,629
88.64%
Purchased
Credit-
impaired (4)
$—
—
10,592
12,590
11,652
—
—
—
—
34,834
2
161
—
41
—
204
204
$ 35,038
3.73%
Loans
Accounted
for Under
the Fair
Value Option
$ 3,321
3,321
$ 3,321
0.35%
Total
Outstandings
$ 166,927
71,519
91,046
66,462
13,108
113,785
27,465
90,308
2,830
643,450
175,586
49,393
21,942
32,029
14,719
293,669
3,321
296,990
$ 940,440
(1) Home loans includes $2.4 billion of fully-insured loans, $818 million of nonperforming loans and $156 million of TDRs that were removed from the Countrywide PCI loan portfolio prior to the adoption
of accounting guidance on PCI loans effective January 1, 2010.
(2) Home loans includes $16.8 billion of fully-insured loans and $372 million of TDRs that were removed from the Countrywide PCI loan portfolio prior to the adoption of accounting guidance on PCI
loans effective January 1, 2010.
(3) Home loans includes $1.1 billion of nonperforming loans as all principal and interest are not current or the loans are TDRs that have not demonstrated sustained repayment performance.
(4) PCI loan amounts are shown gross of the valuation allowance and exclude $1.6 billion of PCI home loans from the Merrill Lynch acquisition which are included in their appropriate aging categories.
(5) Total outstandings includes non-U.S. residential mortgages of $90 million at December 31, 2010.
(6) Total outstandings includes $11.8 billion of pay option loans and $1.3 billion of subprime loans at December 31, 2010. The Corporation no longer originates these products.
(7) Total outstandings includes dealer financial services loans of $43.3 billion, consumer lending loans of $12.4 billion, U.S. securities-based lending margin loans of $16.6 billion, student loans of
$6.8 billion, non-U.S. consumer loans of $8.0 billion and other consumer loans of $3.2 billion at December 31, 2010.
(8) Total outstandings includes consumer finance loans of $1.9 billion, other non-U.S. consumer loans of $803 million and consumer overdrafts of $88 million at December 31, 2010.
(9) Total outstandings includes U.S. commercial real estate loans of $46.9 billion and non-U.S. commercial real estate loans of $2.5 billion at December 31, 2010.
(10) Certain commercial loans are accounted for under the fair value option and include U.S. commercial loans of $1.6 billion, non-U.S. commercial loans of $1.7 billion and commercial real estate loans
of $79 million at December 31, 2010. See Note 22 – Fair Value Measurements and Note 23 – Fair Value Option for additional information.
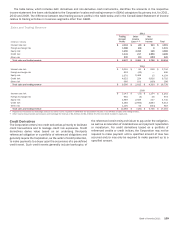
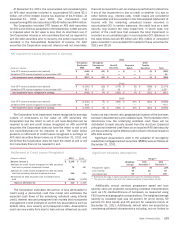
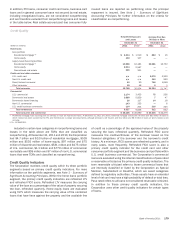
The Corporation mitigates a portion of its credit risk on the
residential mortgage portfolio through the use of synthetic
securitization vehicles. These vehicles issue long-term notes to
investors, the proceeds of which are held as cash collateral. The
Corporation pays a premium to the vehicles to purchase mezzanine
loss protection on a portfolio of residential mortgages owned by
the Corporation. Cash held in the vehicles is used to reimburse
the Corporation in the event that losses on the mortgage portfolio
exceed 10 basis points (bps) of the original pool balance, up to
the remaining amount of purchased loss protection of $783 million
and $1.1 billion at December 31, 2011 and 2010. The vehicles
from which the Corporation purchases credit protection are VIEs.
The Corporation does not have a variable interest in these vehicles.
Accordingly, these vehicles are not consolidated by the
Corporation. Amounts due from the vehicles are recorded in other
income (loss) when the Corporation recognizes a reimbursable
loss, as described above. Amounts are collected when
reimbursable losses are realized through the sale of the underlying
collateral. At December 31, 2011 and 2010, the Corporation had
a receivable of $359 million and $722 million from these vehicles
for reimbursement of losses, and principal of $23.9 billion and
$53.9 billion of residential mortgage loans was referenced under
these agreements. The Corporation records an allowance for credit
losses on these loans without regard to the existence of the
purchased loss protection as the protection does not represent a
guarantee of individual loans.
In addition, the Corporation has entered into long-term credit
protection agreements with FNMA and FHLMC on principal totaling
$23.8 billion and $12.9 billion at December 31, 2011 and 2010,
providing full protection on residential mortgage loans that become
severely delinquent. All of these loans are individually insured and
therefore the Corporation does not record an allowance for credit
losses related to these loans.
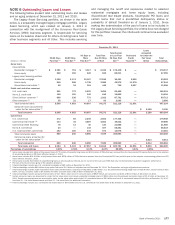
Nonperforming Loans and Leases
The Credit Quality table presents the Corporation’s nonperforming
loans and leases including nonperforming TDRs and loans
accruing past due 90 days or more at December 31, 2011 and
2010. Nonperforming loans and leases exclude performing TDRs
and loans accounted for under the fair value option. Nonperforming
LHFS are excluded from nonperforming loans and leases as they
are recorded at either fair value or the lower of cost or fair value.