Bank of America 2011 Annual Report Download - page 262
Download and view the complete annual report
Please find page 262 of the 2011 Bank of America annual report below. You can navigate through the pages in the report by either clicking on the pages listed below, or by using the keyword search tool below to find specific information within the annual report.-
 1
1 -
2
-
3
-
4
-
5
-
6
-
7
-
8
-
9
-
10
-
11
-
12
-
13
-
14
-
15
-
16
-
17
-
18
-
19
-
20
-
21
-
22
-
23
-
24
-
25
-
26
-
27
-
28
-
29
-
30
-
31
-
32
-
33
-
34
-
35
-
36
-
37
-
38
-
39
-
40
-
41
-
42
-
43
-
44
-
45
-
46
-
47
-
48
-
49
-
50
-
51
-
52
-
53
-
54
-
55
-
56
-
57
-
58
-
59
-
60
-
61
-
62
-
63
-
64
-
65
-
66
-
67
-
68
-
69
-
70
-
71
-
72
-
73
-
74
-
75
-
76
-
77
-
78
-
79
-
80
-
81
-
82
-
83
-
84
-
85
-
86
-
87
-
88
-
89
-
90
-
91
-
92
-
93
-
94
-
95
-
96
-
97
-
98
-
99
-
100
-
101
-
102
-
103
-
104
-
105
-
106
-
107
-
108
-
109
-
110
-
111
-
112
-
113
-
114
-
115
-
116
-
117
-
118
-
119
-
120
-
121
-
122
-
123
-
124
-
125
-
126
-
127
-
128
-
129
-
130
-
131
-
132
-
133
-
134
-
135
-
136
-
137
-
138
-
139
-
140
-
141
-
142
-
143
-
144
-
145
-
146
-
147
-
148
-
149
-
150
-
151
-
152
-
153
-
154
-
155
-
156
-
157
-
158
-
159
-
160
-
161
-
162
-
163
-
164
-
165
-
166
-
167
-
168
-
169
-
170
-
171
-
172
-
173
-
174
-
175
-
176
-
177
-
178
-
179
-
180
-
181
-
182
-
183
-
184
-
185
-
186
-
187
-
188
-
189
-
190
-
191
-
192
-
193
-
194
-
195
-
196
-
197
-
198
-
199
-
200
-
201
-
202
-
203
-
204
-
205
-
206
-
207
-
208
-
209
-
210
-
211
-
212
-
213
-
214
-
215
-
216
-
217
-
218
-
219
-
220
-
221
-
222
-
223
-
224
-
225
-
226
-
227
-
228
-
229
-
230
-
231
-
232
-
233
-
234
-
235
-
236
-
237
-
238
-
239
-
240
-
241
-
242
-
243
-
244
-
245
-
246
-
247
-
248
-
249
-
250
-
251
-
 252
252 -
 253
253 -
 254
254 -
 255
255 -
 256
256 -
 257
257 -
 258
258 -
 259
259 -
 260
260 -
 261
261 -
 262
262 -
 263
263 -
 264
264 -
 265
265 -
 266
266 -
 267
267 -
 268
268 -
 269
269 -
 270
270 -
 271
271 -
 272
272 -
273
-
274
-
275
-
276
 |
 |

260 Bank of America 2011
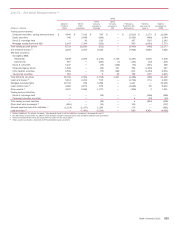
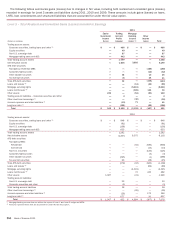
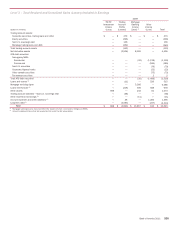
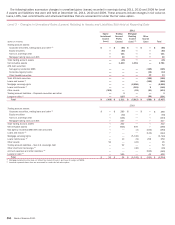
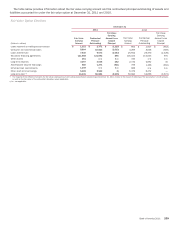
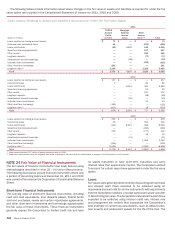
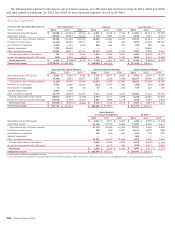
The following tables provide information about where changes in the fair value of assets and liabilities accounted for under the fair
value option are included in the Consolidated Statement of Income for 2011, 2010 and 2009.
Gains (Losses) Relating to Assets and Liabilities Accounted for Under the Fair Value Option
(Dollars in millions)
Loans reported as trading account assets
Consumer and commercial loans
Loans held-for-sale
Securities financing agreements
Other assets
Long-term deposits
Asset-backed secured financings
Unfunded loan commitments
Other short-term borrowings
Long-term debt (2)
Total
Loans reported as trading account assets
Commercial loans
Loans held-for-sale
Securities financing agreements
Other assets
Long-term deposits
Asset-backed secured financings
Unfunded loan commitments
Other short-term borrowings
Long-term debt (2)
Total
Loans reported as trading account assets
Commercial loans
Loans held-for-sale
Securities financing agreements
Other assets
Long-term deposits
Asset-backed secured financings
Unfunded loan commitments
Other short-term borrowings
Long-term debt (2)
Total
2011
Trading
Account
Profits
(Losses)
$73
15
(20)
—
—
—
—
—
261
2,149
$ 2,478
2010
$ 157
2
—
—
—
—
—
—
(192)
(621)
$ (654)
2009
$ 259
25
(211)
—
379
—
—
—
(236)
(3,938)
$ (3,722)
Mortgage
Banking
Income
(Loss)
$—
—
4,137
—
—
—
(30)
—
—
—
$ 4,107
$—
—
9,091
—
—
—
(95)
—
—
—
$ 8,996
$—
—
8,251
—
—
—
(11)
—
—
—
$ 8,240
Other
Income
(Loss) (1)
$—
(275)
148
127
196
(77)
—
(429)
—
3,320
$ 3,010
$—
82
493
52
107
(48)
—
23
—
18
$ 727
$—
521
588
(292)
(177)
35
—
1,365
—
(4,900)
$ (2,860)
Total
$73
(260)
4,265
127
196
(77)
(30)
(429)
261
5,469
$ 9,595
$ 157
84
9,584
52
107
(48)
(95)
23
(192)
(603)
$ 9,069
$ 259
546
8,628
(292)
202
35
(11)
1,365
(236)
(8,838)
$ 1,658
(1) Other assets includes $177 million of equity investment loss for 2009.
(2) Balances in other income (loss) for long-term debt relate to changes in fair value that were attributable to changes in the Corporation’s credit spreads.
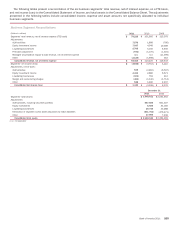
NOTE 24 Fair Value of Financial Instruments
The fair values of financial instruments have been derived using
methodologies described in Note 22 – Fair Value Measurements.
The following disclosures include financial instruments where only
a portion of the ending balance at December 31, 2011 and 2010
was carried at fair value on the Corporation’s Consolidated Balance
Sheet.
Short-term Financial Instruments
The carrying value of short-term financial instruments, including
cash and cash equivalents, time deposits placed, federal funds
sold and purchased, resale and certain repurchase agreements,
and other short-term investments and borrowings approximates
the fair value of these instruments. These financial instruments
generally expose the Corporation to limited credit risk and have
no stated maturities or have short-term maturities and carry
interest rates that approximate market. The Corporation elected
to account for certain repurchase agreements under the fair value
option.
Loans
Fair values were generally determined by discounting both principal
and interest cash flows expected to be collected using an
observable discount rate for similar instruments with adjustments
that the Corporation believes a market participant would consider
in determining fair value. The Corporation estimates the cash flows
expected to be collected using internal credit risk, interest rate
and prepayment risk models that incorporate the Corporation’s
best estimate of current key assumptions, such as default rates,
loss severity and prepayment speeds for the life of the loan. The