Bank of America 2011 Annual Report Download - page 171
Download and view the complete annual report
Please find page 171 of the 2011 Bank of America annual report below. You can navigate through the pages in the report by either clicking on the pages listed below, or by using the keyword search tool below to find specific information within the annual report.-
 1
1 -
2
-
3
-
4
-
5
-
6
-
7
-
8
-
9
-
10
-
11
-
12
-
13
-
14
-
15
-
16
-
17
-
18
-
19
-
20
-
21
-
22
-
23
-
24
-
25
-
26
-
27
-
28
-
29
-
30
-
31
-
32
-
33
-
34
-
35
-
36
-
37
-
38
-
39
-
40
-
41
-
42
-
43
-
44
-
45
-
46
-
47
-
48
-
49
-
50
-
51
-
52
-
53
-
54
-
55
-
56
-
57
-
58
-
59
-
60
-
61
-
62
-
63
-
64
-
65
-
66
-
67
-
68
-
69
-
70
-
71
-
72
-
73
-
74
-
75
-
76
-
77
-
78
-
79
-
80
-
81
-
82
-
83
-
84
-
85
-
86
-
87
-
88
-
89
-
90
-
91
-
92
-
93
-
94
-
95
-
96
-
97
-
98
-
99
-
100
-
101
-
102
-
103
-
104
-
105
-
106
-
107
-
108
-
109
-
110
-
111
-
112
-
113
-
114
-
115
-
116
-
117
-
118
-
119
-
120
-
121
-
122
-
123
-
124
-
125
-
126
-
127
-
128
-
129
-
130
-
131
-
132
-
133
-
134
-
135
-
136
-
137
-
138
-
139
-
140
-
141
-
142
-
143
-
144
-
145
-
146
-
147
-
148
-
149
-
150
-
151
-
152
-
153
-
154
-
155
-
156
-
157
-
158
-
159
-
160
-
 161
161 -
 162
162 -
 163
163 -
 164
164 -
 165
165 -
 166
166 -
 167
167 -
 168
168 -
 169
169 -
 170
170 -
 171
171 -
 172
172 -
 173
173 -
 174
174 -
 175
175 -
 176
176 -
 177
177 -
 178
178 -
 179
179 -
 180
180 -
 181
181 -
182
-
183
-
184
-
185
-
186
-
187
-
188
-
189
-
190
-
191
-
192
-
193
-
194
-
195
-
196
-
197
-
198
-
199
-
200
-
201
-
202
-
203
-
204
-
205
-
206
-
207
-
208
-
209
-
210
-
211
-
212
-
213
-
214
-
215
-
216
-
217
-
218
-
219
-
220
-
221
-
222
-
223
-
224
-
225
-
226
-
227
-
228
-
229
-
230
-
231
-
232
-
233
-
234
-
235
-
236
-
237
-
238
-
239
-
240
-
241
-
242
-
243
-
244
-
245
-
246
-
247
-
248
-
249
-
250
-
251
-
252
-
253
-
254
-
255
-
256
-
257
-
258
-
259
-
260
-
261
-
262
-
263
-
264
-
265
-
266
-
267
-
268
-
269
-
270
-
271
-
272
-
273
-
274
-
275
-
276
 |
 |

Bank of America 2011 169
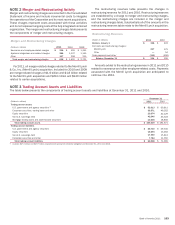
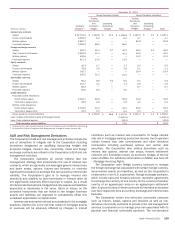
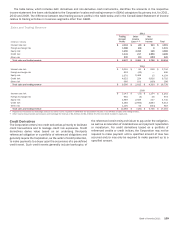
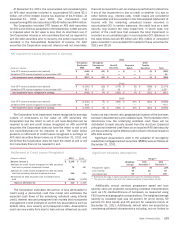
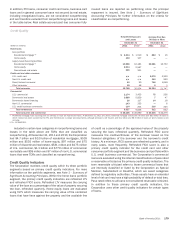
The table below, which includes both derivatives and non-derivative cash instruments, identifies the amounts in the respective
income statement line items attributable to the Corporation’s sales and trading revenue in GBAM, categorized by primary risk, for 2011,
2010 and 2009. The difference between total trading account profits in the table below and in the Consolidated Statement of Income
relates to trading activities in business segments other than GBAM.
Sales and Trading Revenue
(Dollars in millions)
Interest rate risk
Foreign exchange risk
Equity risk
Credit risk
Other risk
Total sales and trading revenue
Interest rate risk
Foreign exchange risk
Equity risk
Credit risk
Other risk
Total sales and trading revenue
Interest rate risk
Foreign exchange risk
Equity risk
Credit risk
Other risk
Total sales and trading revenue
2011
Trading
Account
Profits
$ 2,118
1,088
1,450
1,141
630
$ 6,427
2010
$ 2,005
903
1,670
4,652
366
$ 9,596
2009
$ 3,143
950
1,989
4,486
1,100
$ 11,668
Other
Income
(Loss) (1, 2)
$ (40)
(65)
2,390
217
(21)
$ 2,481
$81
(63)
2,469
224
101
$ 2,812
$ (23)
(3)
2,509
(2,956)
53
$ (420)
Net
Interest
Income
$923
8
128
2,850
(183)
$ 3,726
$ 658
—
15
3,826
(169)
$ 4,330
$ 1,134
26
247
4,883
(534)
$ 5,756
Total
$ 3,001
1,031
3,968
4,208
426
$ 12,634
$ 2,744
840
4,154
8,702
298
$ 16,738
$ 4,254
973
4,745
6,413
619
$ 17,004
(1) Represents investment and brokerage services and other income recorded in GBAM that the Corporation includes in its definition of sales and trading revenue.
(2) Other income (loss) includes commissions and brokerage fee revenue of $2.3 billion and $2.4 billion for 2011 and 2010 included in equity risk.
Credit Derivatives
The Corporation enters into credit derivatives primarily to facilitate
client transactions and to manage credit risk exposures. Credit
derivatives derive value based on an underlying third-party
referenced obligation or a portfolio of referenced obligations and
generally require the Corporation, as the seller of credit protection,
to make payments to a buyer upon the occurrence of a pre-defined
credit event. Such credit events generally include bankruptcy of
the referenced credit entity and failure to pay under the obligation,
as well as acceleration of indebtedness and payment repudiation
or moratorium. For credit derivatives based on a portfolio of
referenced credits or credit indices, the Corporation may not be
required to make payment until a specified amount of loss has
occurred and/or may only be required to make payment up to a
specified amount.