Bank of America 2011 Annual Report Download - page 89
Download and view the complete annual report
Please find page 89 of the 2011 Bank of America annual report below. You can navigate through the pages in the report by either clicking on the pages listed below, or by using the keyword search tool below to find specific information within the annual report.-
 1
1 -
2
-
3
-
4
-
5
-
6
-
7
-
8
-
9
-
10
-
11
-
12
-
13
-
14
-
15
-
16
-
17
-
18
-
19
-
20
-
21
-
22
-
23
-
24
-
25
-
26
-
27
-
28
-
29
-
30
-
31
-
32
-
33
-
34
-
35
-
36
-
37
-
38
-
39
-
40
-
41
-
42
-
43
-
44
-
45
-
46
-
47
-
48
-
49
-
50
-
51
-
52
-
53
-
54
-
55
-
56
-
57
-
58
-
59
-
60
-
61
-
62
-
63
-
64
-
65
-
66
-
67
-
68
-
69
-
70
-
71
-
72
-
73
-
74
-
75
-
76
-
77
-
78
-
 79
79 -
 80
80 -
 81
81 -
 82
82 -
 83
83 -
 84
84 -
 85
85 -
 86
86 -
 87
87 -
 88
88 -
 89
89 -
 90
90 -
 91
91 -
 92
92 -
 93
93 -
 94
94 -
 95
95 -
 96
96 -
 97
97 -
 98
98 -
 99
99 -
100
-
101
-
102
-
103
-
104
-
105
-
106
-
107
-
108
-
109
-
110
-
111
-
112
-
113
-
114
-
115
-
116
-
117
-
118
-
119
-
120
-
121
-
122
-
123
-
124
-
125
-
126
-
127
-
128
-
129
-
130
-
131
-
132
-
133
-
134
-
135
-
136
-
137
-
138
-
139
-
140
-
141
-
142
-
143
-
144
-
145
-
146
-
147
-
148
-
149
-
150
-
151
-
152
-
153
-
154
-
155
-
156
-
157
-
158
-
159
-
160
-
161
-
162
-
163
-
164
-
165
-
166
-
167
-
168
-
169
-
170
-
171
-
172
-
173
-
174
-
175
-
176
-
177
-
178
-
179
-
180
-
181
-
182
-
183
-
184
-
185
-
186
-
187
-
188
-
189
-
190
-
191
-
192
-
193
-
194
-
195
-
196
-
197
-
198
-
199
-
200
-
201
-
202
-
203
-
204
-
205
-
206
-
207
-
208
-
209
-
210
-
211
-
212
-
213
-
214
-
215
-
216
-
217
-
218
-
219
-
220
-
221
-
222
-
223
-
224
-
225
-
226
-
227
-
228
-
229
-
230
-
231
-
232
-
233
-
234
-
235
-
236
-
237
-
238
-
239
-
240
-
241
-
242
-
243
-
244
-
245
-
246
-
247
-
248
-
249
-
250
-
251
-
252
-
253
-
254
-
255
-
256
-
257
-
258
-
259
-
260
-
261
-
262
-
263
-
264
-
265
-
266
-
267
-
268
-
269
-
270
-
271
-
272
-
273
-
274
-
275
-
276
 |
 |

Bank of America 2011 87
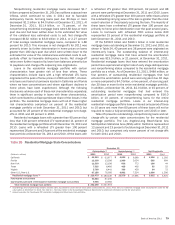
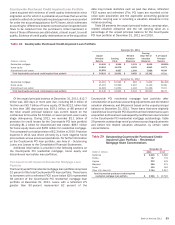
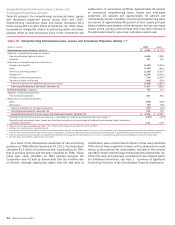
PCI loan portfolio prior to the adoption of this accounting guidance
were $1.9 billion and $2.1 billion at December 31, 2011 and
2010, of which $477 million and $426 million were nonper-
forming. These nonperforming loans are excluded from Table 36.
Nonperforming consumer real estate TDRs as a percentage of
total nonperforming consumer loans and foreclosed properties
increased to 26 percent at December 31, 2011 from 16 percent
at December 31, 2010.
Table 36
(Dollars in millions)
Nonperforming loans, January 1
Additions to nonperforming loans:
New nonperforming loans (2)
Reductions to nonperforming loans:
Paydowns and payoffs
Returns to performing status (3)
Charge-offs (4)
Transfers to foreclosed properties
Total net additions (reductions) to nonperforming loans
Total nonperforming loans, December 31 (5)
Foreclosed properties, January 1
Additions to foreclosed properties:
New foreclosed properties
Reductions to foreclosed properties:
Sales
Write-downs
Total net additions (reductions) to foreclosed properties
Total foreclosed properties, December 31
Nonperforming consumer loans and foreclosed properties, December 31
Nonperforming consumer loans as a percentage of outstanding consumer loans (6)
Nonperforming consumer loans and foreclosed properties as a percentage of outstanding consumer loans and foreclosed properties (6)
Nonperforming Consumer Loans and Foreclosed Properties Activity (1)
2011
$20,854
15,723
(3,318)
(4,741)
(8,095)
(1,655)
(2,086)
18,768
1,249
2,996
(1,993)
(261)
742
1,991
$20,759
3.09%
3.41
2010
$ 20,839
21,584
(2,809)
(7,647)
(9,772)
(1,341)
15
20,854
1,428
2,337
(2,327)
(189)
(179)
1,249
$ 22,103
3.24%
3.43
(1) Balances do not include nonperforming LHFS of $659 million and $1.0 billion at December 31, 2011 and 2010 as well as loans accruing past due 90 days or more as presented in Table 21 and
Note 6 – Outstanding Loans and Leases to the Consolidated Financial Statements.
(2) 2010 includes $448 million of nonperforming loans as a result of the consolidation of variable interest entities.
(3) Consumer loans may be returned to performing status when all principal and interest is current and full repayment of the remaining contractual principal and interest is expected, or when the loan
otherwise becomes well-secured and is in the process of collection. Certain TDRs are classified as nonperforming at the time of restructuring and may only be returned to performing status after
considering the borrower’s sustained repayment performance for a reasonable period, generally six months.
(4) Our policy is to not classify consumer credit card and consumer loans not secured by real estate as nonperforming; therefore, the charge-offs on these loans have no impact on nonperforming activity
and accordingly, are excluded from this table.
(5) At December 31, 2011, 67 percent of nonperforming loans 180 days or more past due were written down through charge-offs to 64 percent of the unpaid principal balance.
(6) Outstanding consumer loans exclude loans accounted for under the fair value option.
Our policy is to record any losses in the value of foreclosed
properties as a reduction in the allowance for loan and lease losses
during the first 90 days after transfer of a loan to foreclosed
properties. Thereafter, all gains and losses in value are recorded
in noninterest expense. New foreclosed properties in Table 36 are
net of $352 million and $575 million of charge-offs for 2011 and
2010, recorded during the first 90 days after transfer.
We also work with customers that are experiencing financial
difficulty by modifying credit card and other consumer loans, while
complying with Federal Financial Institutions Examination Council
(FFIEC) guidelines. Substantially all of our credit card and other
consumer loan modifications involve a reduction in the
cardholder’s interest rate on the account and placing the customer
on a fixed payment plan not exceeding 60 months, all of which are
considered to be TDRs (the renegotiated TDR portfolio). We make
modifications primarily through internal renegotiation programs
utilizing direct customer contact, but may also utilize external
renegotiation programs. The renegotiated TDR portfolio is
excluded from Table 36, as substantially all of these loans remain
on accrual status until either charged-off or paid in full. At
December 31, 2011, our renegotiated TDR portfolio was $7.1
billion, of which $5.5 billion was current or less than 30 days past
due under the modified terms compared to $11.4 billion at
December 31, 2010, of which $8.7 billion was current or less than
30 days past due under the modified terms. The decline in the
renegotiated TDR portfolio was primarily driven by attrition
throughout 2011 as well as lower new program enrollments. For
more information on the renegotiated TDR portfolio, see Note 6 –
Outstanding Loans and Leases to the Consolidated Financial
Statements.
As a result of new accounting guidance on TDRs, loans that
are participating in or that have been offered a binding trial
modification are classified as TDRs. At December 31, 2011, we
classified an additional $2.6 billion of home loans as TDRs that
were participating in or had been offered a trial modification. These
home loans had an aggregate allowance for credit losses of $154
million at December 31, 2011. For additional information, see
Note 1 – Summary of Significant Accounting Principles to the
Consolidated Financial Statements.