Bank of America 2011 Annual Report Download - page 176
Download and view the complete annual report
Please find page 176 of the 2011 Bank of America annual report below. You can navigate through the pages in the report by either clicking on the pages listed below, or by using the keyword search tool below to find specific information within the annual report.-
 1
1 -
2
-
3
-
4
-
5
-
6
-
7
-
8
-
9
-
10
-
11
-
12
-
13
-
14
-
15
-
16
-
17
-
18
-
19
-
20
-
21
-
22
-
23
-
24
-
25
-
26
-
27
-
28
-
29
-
30
-
31
-
32
-
33
-
34
-
35
-
36
-
37
-
38
-
39
-
40
-
41
-
42
-
43
-
44
-
45
-
46
-
47
-
48
-
49
-
50
-
51
-
52
-
53
-
54
-
55
-
56
-
57
-
58
-
59
-
60
-
61
-
62
-
63
-
64
-
65
-
66
-
67
-
68
-
69
-
70
-
71
-
72
-
73
-
74
-
75
-
76
-
77
-
78
-
79
-
80
-
81
-
82
-
83
-
84
-
85
-
86
-
87
-
88
-
89
-
90
-
91
-
92
-
93
-
94
-
95
-
96
-
97
-
98
-
99
-
100
-
101
-
102
-
103
-
104
-
105
-
106
-
107
-
108
-
109
-
110
-
111
-
112
-
113
-
114
-
115
-
116
-
117
-
118
-
119
-
120
-
121
-
122
-
123
-
124
-
125
-
126
-
127
-
128
-
129
-
130
-
131
-
132
-
133
-
134
-
135
-
136
-
137
-
138
-
139
-
140
-
141
-
142
-
143
-
144
-
145
-
146
-
147
-
148
-
149
-
150
-
151
-
152
-
153
-
154
-
155
-
156
-
157
-
158
-
159
-
160
-
161
-
162
-
163
-
164
-
165
-
 166
166 -
 167
167 -
 168
168 -
 169
169 -
 170
170 -
 171
171 -
 172
172 -
 173
173 -
 174
174 -
 175
175 -
 176
176 -
 177
177 -
 178
178 -
 179
179 -
 180
180 -
 181
181 -
 182
182 -
 183
183 -
 184
184 -
 185
185 -
 186
186 -
187
-
188
-
189
-
190
-
191
-
192
-
193
-
194
-
195
-
196
-
197
-
198
-
199
-
200
-
201
-
202
-
203
-
204
-
205
-
206
-
207
-
208
-
209
-
210
-
211
-
212
-
213
-
214
-
215
-
216
-
217
-
218
-
219
-
220
-
221
-
222
-
223
-
224
-
225
-
226
-
227
-
228
-
229
-
230
-
231
-
232
-
233
-
234
-
235
-
236
-
237
-
238
-
239
-
240
-
241
-
242
-
243
-
244
-
245
-
246
-
247
-
248
-
249
-
250
-
251
-
252
-
253
-
254
-
255
-
256
-
257
-
258
-
259
-
260
-
261
-
262
-
263
-
264
-
265
-
266
-
267
-
268
-
269
-
270
-
271
-
272
-
273
-
274
-
275
-
276
 |
 |

174 Bank of America 2011
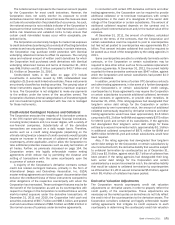
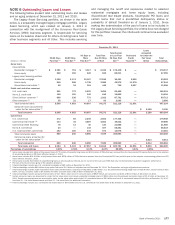
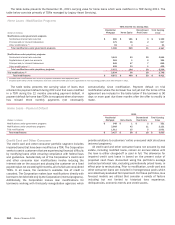
LTV, FICO and geographic concentration. Weighted-average life
default rates by collateral type were 36 percent for prime bonds,
62 percent for Alt-A bonds and 72 percent for subprime bonds at
December 31, 2011.
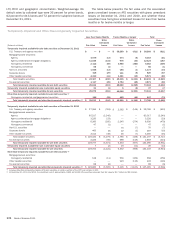
The table below presents the fair value and the associated
gross unrealized losses on AFS securities with gross unrealized
losses at December 31, 2011 and 2010, and whether these
securities have had gross unrealized losses for less than twelve
months or for twelve months or longer.
Temporarily impaired and Other-than-temporarily Impaired Securities
(Dollars in millions)
Temporarily impaired available-for-sale debt securities at December 31, 2011
U.S. Treasury and agency securities
Mortgage-backed securities:
Agency
Agency collateralized mortgage obligations
Non-agency residential
Non-agency commercial
Non-U.S. securities
Corporate bonds
Other taxable securities
Total taxable securities
Tax-exempt securities
Total temporarily impaired available-for-sale debt securities
Temporarily impaired available-for-sale marketable equity securities
Total temporarily impaired available-for-sale securities
Other-than-temporarily impaired available-for-sale debt securities (1)
Non-agency residential mortgage-backed securities
Total temporarily impaired and other-than-temporarily impaired securities (2)
Temporarily impaired available-for-sale debt securities at December 31, 2010
U.S. Treasury and agency securities
Mortgage-backed securities:
Agency
Agency collateralized mortgage obligations
Non-agency residential
Non-agency commercial
Non-U.S. securities
Corporate bonds
Other taxable securities
Total taxable securities
Tax-exempt securities
Total temporarily impaired available-for-sale debt securities
Temporarily impaired available-for-sale marketable equity securities
Total temporarily impaired available-for-sale securities
Other-than-temporarily impaired available-for-sale debt securities (1)
Mortgage-backed securities:
Non-agency residential
Other taxable securities
Tax-exempt securities
Total temporarily impaired and other-than-temporarily impaired securities (2)
Less than Twelve Months
Fair Value
$—
4,679
11,448
2,112
55
1,008
415
4,210
$ 23,927
1,117
25,044
31
25,075
158
$ 25,233
$ 27,384
85,517
3,220
6,385
47
—
465
3,414
$ 126,432
2,325
128,757
7
128,764
128
—
68
$ 128,960
Gross
Unrealized
Losses
$—
(13)
(134)
(59)
(1)
(13)
(29)
(41)
$ (290)
(25)
(315)
(1)
(316)
(28)
$ (344)
$ (763)
(2,240)
(23)
(205)
(1)
—
(9)
(38)
$ (3,279)
(95)
(3,374)
(2)
(3,376)
(11)
—
(8)
$ (3,395)
Twelve Months or Longer
Fair Value
$ 38,269
474
976
3,950
—
165
111
1,361
$ 45,306
2,754
48,060
6
48,066
489
$ 48,555
$ 2,382
—
—
2,245
—
70
22
46
$4,765
568
5,333
19
5,352
530
223
—
$ 6,105
Gross
Unrealized
Losses
$(811)
(8)
(33)
(350)
—
(1)
(8)
(19)
$(1,230)
(65)
(1,295)
(6)
(1,301)
(45)
$(1,346)
$ (149)
—
—
(274)
—
(7)
(1)
(7)
$ (438)
(119)
(557)
(11)
(568)
(439)
(116)
—
$ (1,123)
Total
Fair Value
$38,269
5,153
12,424
6,062
55
1,173
526
5,571
$69,233
3,871
73,104
37
73,141
647
$73,788
$ 29,766
85,517
3,220
8,630
47
70
487
3,460
$ 131,197
2,893
134,090
26
134,116
658
223
68
$ 135,065
Gross
Unrealized
Losses
$(811)
(21)
(167)
(409)
(1)
(14)
(37)
(60)
$ (1,520)
(90)
(1,610)
(7)
(1,617)
(73)
$ (1,690)
$ (912)
(2,240)
(23)
(479)
(1)
(7)
(10)
(45)
$ (3,717)
(214)
(3,931)
(13)
(3,944)
(450)
(116)
(8)
$ (4,518)
(1) Includes other-than-temporarily impaired AFS debt securities on which a portion of the OTTI loss remains in OCI.
(2) At December 31, 2011 and 2010, the amortized cost of approximately 3,800 and 8,500 AFS securities exceeded their fair value by $1.7 billion and $4.5 billion.