Bank of America 2011 Annual Report Download - page 111
Download and view the complete annual report
Please find page 111 of the 2011 Bank of America annual report below. You can navigate through the pages in the report by either clicking on the pages listed below, or by using the keyword search tool below to find specific information within the annual report.-
 1
1 -
2
-
3
-
4
-
5
-
6
-
7
-
8
-
9
-
10
-
11
-
12
-
13
-
14
-
15
-
16
-
17
-
18
-
19
-
20
-
21
-
22
-
23
-
24
-
25
-
26
-
27
-
28
-
29
-
30
-
31
-
32
-
33
-
34
-
35
-
36
-
37
-
38
-
39
-
40
-
41
-
42
-
43
-
44
-
45
-
46
-
47
-
48
-
49
-
50
-
51
-
52
-
53
-
54
-
55
-
56
-
57
-
58
-
59
-
60
-
61
-
62
-
63
-
64
-
65
-
66
-
67
-
68
-
69
-
70
-
71
-
72
-
73
-
74
-
75
-
76
-
77
-
78
-
79
-
80
-
81
-
82
-
83
-
84
-
85
-
86
-
87
-
88
-
89
-
90
-
91
-
92
-
93
-
94
-
95
-
96
-
97
-
98
-
99
-
100
-
 101
101 -
 102
102 -
 103
103 -
 104
104 -
 105
105 -
 106
106 -
 107
107 -
 108
108 -
 109
109 -
 110
110 -
 111
111 -
 112
112 -
 113
113 -
 114
114 -
 115
115 -
 116
116 -
 117
117 -
 118
118 -
 119
119 -
 120
120 -
 121
121 -
122
-
123
-
124
-
125
-
126
-
127
-
128
-
129
-
130
-
131
-
132
-
133
-
134
-
135
-
136
-
137
-
138
-
139
-
140
-
141
-
142
-
143
-
144
-
145
-
146
-
147
-
148
-
149
-
150
-
151
-
152
-
153
-
154
-
155
-
156
-
157
-
158
-
159
-
160
-
161
-
162
-
163
-
164
-
165
-
166
-
167
-
168
-
169
-
170
-
171
-
172
-
173
-
174
-
175
-
176
-
177
-
178
-
179
-
180
-
181
-
182
-
183
-
184
-
185
-
186
-
187
-
188
-
189
-
190
-
191
-
192
-
193
-
194
-
195
-
196
-
197
-
198
-
199
-
200
-
201
-
202
-
203
-
204
-
205
-
206
-
207
-
208
-
209
-
210
-
211
-
212
-
213
-
214
-
215
-
216
-
217
-
218
-
219
-
220
-
221
-
222
-
223
-
224
-
225
-
226
-
227
-
228
-
229
-
230
-
231
-
232
-
233
-
234
-
235
-
236
-
237
-
238
-
239
-
240
-
241
-
242
-
243
-
244
-
245
-
246
-
247
-
248
-
249
-
250
-
251
-
252
-
253
-
254
-
255
-
256
-
257
-
258
-
259
-
260
-
261
-
262
-
263
-
264
-
265
-
266
-
267
-
268
-
269
-
270
-
271
-
272
-
273
-
274
-
275
-
276
 |
 |
Bank of America 2011 109
The accuracy of the VaR methodology is reviewed by
backtesting, which involves comparing actual results against
expectations derived from historical data, the VaR results against
the daily profit and loss. Graphic representation of the backtesting
results with additional explanation of backtesting excesses are
reported to the GRC. Backtesting excesses occur when trading
losses exceed VaR. Senior management reviews and evaluates
the results of these tests. In periods of market stress, the GRC
members communicate daily to discuss losses and VaR limit
excesses. As a result of this process, the businesses may
selectively reduce risk. Where economically feasible, positions are
sold or macroeconomic hedges are executed to reduce the
exposure.
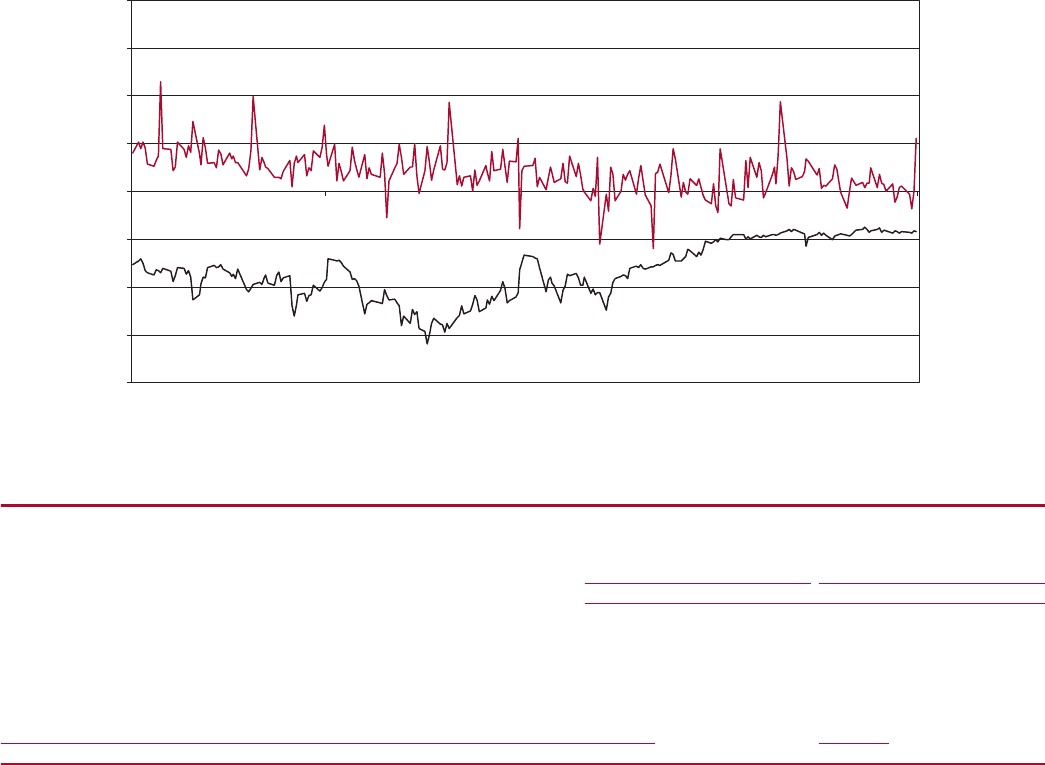
Our VaR model uses a historical simulation approach based on
three years of historical data and an expected shortfall
methodology equivalent to a 99 percent confidence level.
Statistically, this means that losses will exceed VaR, on average,
one out of 100 trading days, or two to three times each year. The
number of actual backtesting excesses observed is dependent on
current market performance relative to historic market volatility.
For most of 2011, the three years of historical market data utilized
for VaR included the volatile fourth quarter of 2008. Subsequent
market volatility has generally been lower, and as a result, the size
of the largest trading losses experienced since then has been
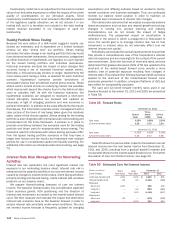
lower than would be expected based on the VaR measure. Actual
losses did not exceed daily trading VaR in 2011 or 2010. The
graph below shows daily trading-related revenue and VaR for 2011.
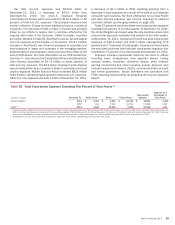
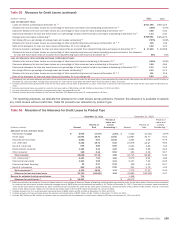
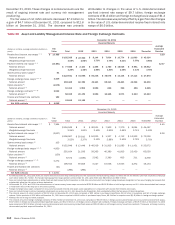
Table 57 presents average, high and low daily trading VaR for 2011 and 2010.
Table 57
(Dollars in millions)
Foreign exchange
Interest rate
Credit
Real estate/mortgage
Equities
Commodities
Portfolio diversification
Total market-based trading portfolio
Market Risk VaR for Trading Activities
2011
Average
$20.0
50.6
109.9
80.0
50.5
18.9
(163.1)
$ 166.8
High (1)
$48.6
82.7
155.3
139.5
88.9
33.8
—
$ 318.6
Low (1)
$ 5.6
29.2
54.8
31.5
25.1
8.4
—
$75.0
2010
Average
$ 23.8
64.1
171.5
83.1
39.4
19.9
(200.5)
$ 201.3
High (1)
$ 73.1
128.3
287.2
138.5
90.9
31.7
—
$ 375.2
Low (1)
$ 4.9
33.2
122.9
42.9
20.8
12.8
—
$ 123.0
(1) The high and low for the total portfolio may not equal the sum of the individual components as the highs or lows of the individual portfolios may have occurred on different trading days.
The $35 million decrease in average VaR during 2011 was
primarily due to a reduction in risk during the year. This was driven
primarily by a decrease in credit exposures where average VaR
decreased $62 million compared to 2010. In addition, for 2010
and 2011, data from the more volatile periods of 2007 and 2008
were no longer included in our three-year historical dataset. These
impacts were partially offset by a reduction in portfolio
diversification VaR of $37 million.
-400
-300
-200
-100
0
100
200
300
400
12/31/2010 3/31/2011 6/30/2011 9/30/2011 12/31/2011
(Dollars in millions)
Trading Risk and Return
Daily Trading-related Revenue and VaR
Daily
Trading-
related
Revenue
VaR