Bank of America 2011 Annual Report Download - page 270
Download and view the complete annual report
Please find page 270 of the 2011 Bank of America annual report below. You can navigate through the pages in the report by either clicking on the pages listed below, or by using the keyword search tool below to find specific information within the annual report.-
 1
1 -
2
-
3
-
4
-
5
-
6
-
7
-
8
-
9
-
10
-
11
-
12
-
13
-
14
-
15
-
16
-
17
-
18
-
19
-
20
-
21
-
22
-
23
-
24
-
25
-
26
-
27
-
28
-
29
-
30
-
31
-
32
-
33
-
34
-
35
-
36
-
37
-
38
-
39
-
40
-
41
-
42
-
43
-
44
-
45
-
46
-
47
-
48
-
49
-
50
-
51
-
52
-
53
-
54
-
55
-
56
-
57
-
58
-
59
-
60
-
61
-
62
-
63
-
64
-
65
-
66
-
67
-
68
-
69
-
70
-
71
-
72
-
73
-
74
-
75
-
76
-
77
-
78
-
79
-
80
-
81
-
82
-
83
-
84
-
85
-
86
-
87
-
88
-
89
-
90
-
91
-
92
-
93
-
94
-
95
-
96
-
97
-
98
-
99
-
100
-
101
-
102
-
103
-
104
-
105
-
106
-
107
-
108
-
109
-
110
-
111
-
112
-
113
-
114
-
115
-
116
-
117
-
118
-
119
-
120
-
121
-
122
-
123
-
124
-
125
-
126
-
127
-
128
-
129
-
130
-
131
-
132
-
133
-
134
-
135
-
136
-
137
-
138
-
139
-
140
-
141
-
142
-
143
-
144
-
145
-
146
-
147
-
148
-
149
-
150
-
151
-
152
-
153
-
154
-
155
-
156
-
157
-
158
-
159
-
160
-
161
-
162
-
163
-
164
-
165
-
166
-
167
-
168
-
169
-
170
-
171
-
172
-
173
-
174
-
175
-
176
-
177
-
178
-
179
-
180
-
181
-
182
-
183
-
184
-
185
-
186
-
187
-
188
-
189
-
190
-
191
-
192
-
193
-
194
-
195
-
196
-
197
-
198
-
199
-
200
-
201
-
202
-
203
-
204
-
205
-
206
-
207
-
208
-
209
-
210
-
211
-
212
-
213
-
214
-
215
-
216
-
217
-
218
-
219
-
220
-
221
-
222
-
223
-
224
-
225
-
226
-
227
-
228
-
229
-
230
-
231
-
232
-
233
-
234
-
235
-
236
-
237
-
238
-
239
-
240
-
241
-
242
-
243
-
244
-
245
-
246
-
247
-
248
-
249
-
250
-
251
-
252
-
253
-
254
-
255
-
256
-
257
-
258
-
259
-
 260
260 -
 261
261 -
 262
262 -
 263
263 -
 264
264 -
 265
265 -
 266
266 -
 267
267 -
 268
268 -
 269
269 -
 270
270 -
 271
271 -
 272
272 -
 273
273 -
 274
274 -
 275
275 -
 276
276
 |
 |

268 Bank of America 2011
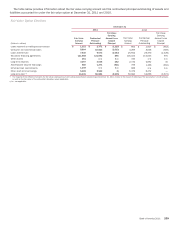
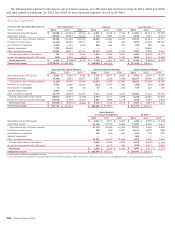
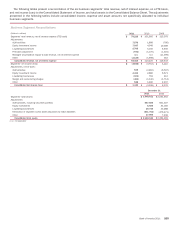
NOTE 28 Performance by Geographical Area
Since the Corporation’s operations are highly integrated, certain asset, liability, income and expense amounts must be allocated to
arrive at total assets, total revenue, net of interest expense, income (loss) before income taxes and net income (loss) by geographic
area. The Corporation identifies its geographic performance based on the business unit structure used to manage the capital or expense
deployed in the region as applicable. This requires certain judgments related to the allocation of revenue so that revenue can be
appropriately matched with the related expense or capital deployed in the region.
(Dollars in millions)
U.S. (3)
Asia (4)
Europe, Middle East and Africa
Latin America and the Caribbean
Total Non-U.S.
Total Consolidated
Year
2011
2010
2009
2011
2010
2009
2011
2010
2009
2011
2010
2009
2011
2010
2009
2011
2010
2009
December 31
Total Assets (1)
$ 1,856,654
1,975,640
95,776
107,140
151,956
160,621
24,660
21,508
272,392
289,269
$ 2,129,046
2,264,909
Year Ended December 31
Total Revenue,
Net of Interest
Expense (2)
$ 73,613
95,115
98,278
10,890
4,187
10,685
7,320
8,490
9,085
1,631
2,428
1,595
19,841
15,105
21,365
$ 93,454
110,220
119,643
Income (Loss)
Before Income
Taxes
$(9,261)
(5,676)
(6,901)
7,598
1,372
8,096
1,009
1,549
2,295
424
1,432
870
9,031
4,353
11,261
$(230)
(1,323)
4,360
Net Income
(Loss)
$ (3,471)
(4,727)
(1,025)
4,787
864
5,101
(137)
723
1,652
267
902
548
4,917
2,489
7,301
$ 1,446
(2,238)
6,276
(1) Total assets include long-lived assets, which are primarily located in the U.S.
(2) There were no material intercompany revenues between geographic regions for any of the periods presented.
(3) Includes the Corporation’s Canadian operations, which had total assets of $8.1 billion and $16.1 billion at December 31, 2011 and 2010; total revenue, net of interest expense of $1.3 billion, $1.3
billion and $2.5 billion; income before income taxes of $621 million, $458 million and $723 million; and net income of $528 million, $328 million and $488 million for 2011, 2010 and 2009,
respectively.
(4) Amounts include pre-tax gains of $6.5 billion and $7.3 billion ($4.1 billion and $4.6 billion net-of-tax) on the sale of common shares of the Corporation’s investment in CCB during 2011 and 2009.