Bank of America 2011 Annual Report Download - page 192
Download and view the complete annual report
Please find page 192 of the 2011 Bank of America annual report below. You can navigate through the pages in the report by either clicking on the pages listed below, or by using the keyword search tool below to find specific information within the annual report.-
 1
1 -
2
-
3
-
4
-
5
-
6
-
7
-
8
-
9
-
10
-
11
-
12
-
13
-
14
-
15
-
16
-
17
-
18
-
19
-
20
-
21
-
22
-
23
-
24
-
25
-
26
-
27
-
28
-
29
-
30
-
31
-
32
-
33
-
34
-
35
-
36
-
37
-
38
-
39
-
40
-
41
-
42
-
43
-
44
-
45
-
46
-
47
-
48
-
49
-
50
-
51
-
52
-
53
-
54
-
55
-
56
-
57
-
58
-
59
-
60
-
61
-
62
-
63
-
64
-
65
-
66
-
67
-
68
-
69
-
70
-
71
-
72
-
73
-
74
-
75
-
76
-
77
-
78
-
79
-
80
-
81
-
82
-
83
-
84
-
85
-
86
-
87
-
88
-
89
-
90
-
91
-
92
-
93
-
94
-
95
-
96
-
97
-
98
-
99
-
100
-
101
-
102
-
103
-
104
-
105
-
106
-
107
-
108
-
109
-
110
-
111
-
112
-
113
-
114
-
115
-
116
-
117
-
118
-
119
-
120
-
121
-
122
-
123
-
124
-
125
-
126
-
127
-
128
-
129
-
130
-
131
-
132
-
133
-
134
-
135
-
136
-
137
-
138
-
139
-
140
-
141
-
142
-
143
-
144
-
145
-
146
-
147
-
148
-
149
-
150
-
151
-
152
-
153
-
154
-
155
-
156
-
157
-
158
-
159
-
160
-
161
-
162
-
163
-
164
-
165
-
166
-
167
-
168
-
169
-
170
-
171
-
172
-
173
-
174
-
175
-
176
-
177
-
178
-
179
-
180
-
181
-
 182
182 -
 183
183 -
 184
184 -
 185
185 -
 186
186 -
 187
187 -
 188
188 -
 189
189 -
 190
190 -
 191
191 -
 192
192 -
 193
193 -
 194
194 -
 195
195 -
 196
196 -
 197
197 -
 198
198 -
 199
199 -
 200
200 -
 201
201 -
 202
202 -
203
-
204
-
205
-
206
-
207
-
208
-
209
-
210
-
211
-
212
-
213
-
214
-
215
-
216
-
217
-
218
-
219
-
220
-
221
-
222
-
223
-
224
-
225
-
226
-
227
-
228
-
229
-
230
-
231
-
232
-
233
-
234
-
235
-
236
-
237
-
238
-
239
-
240
-
241
-
242
-
243
-
244
-
245
-
246
-
247
-
248
-
249
-
250
-
251
-
252
-
253
-
254
-
255
-
256
-
257
-
258
-
259
-
260
-
261
-
262
-
263
-
264
-
265
-
266
-
267
-
268
-
269
-
270
-
271
-
272
-
273
-
274
-
275
-
276
 |
 |

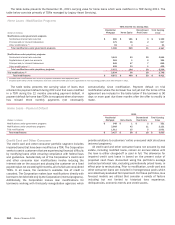
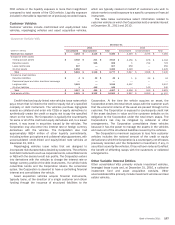
190 Bank of America 2011
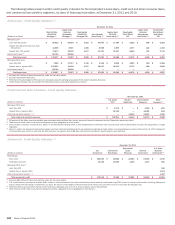
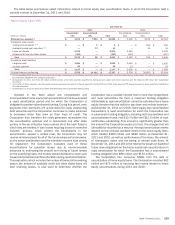
The table below presents the allowance and the carrying value of outstanding loans and leases by portfolio segment at December
31, 2011 and 2010.
Allowance and Carrying Value by Portfolio Segment
(Dollars in millions)
Impaired loans and troubled debt restructurings (1)
Allowance for loan and lease losses (2)
Carrying value (3)
Allowance as a percentage of carrying value
Collectively evaluated for impairment
Allowance for loan and lease losses
Carrying value (3, 4)
Allowance as a percentage of carrying value (4)
Purchased credit-impaired loans
Valuation allowance
Carrying value gross of valuation allowance
Valuation allowance as a percentage of carrying value
Total
Allowance for loan and lease losses
Carrying value (3, 4)
Allowance as a percentage of carrying value (4)
December 31, 2011
Home
Loans
$ 1,946
21,462
9.07%
$ 10,674
344,821
3.10%
$ 8,459
31,801
26.60%
$ 21,079
398,084
5.30%
Credit Card
and Other
Consumer
$ 2,410
7,100
33.94%
$ 6,159
202,010
3.05%
n/a
n/a
n/a
$ 8,569
209,110
4.10%
Commercial
$545
8,113
6.71%
$ 3,590
302,089
1.19%
n/a
n/a
n/a
$ 4,135
310,202
1.33%
Total
$ 4,901
36,675
13.36%
$ 20,423
848,920
2.41%
$ 8,459
31,801
26.60%
$ 33,783
917,396
3.68%
Impaired loans and troubled debt restructurings (1)
Allowance for loan and lease losses (2)
Carrying value (3)
Allowance as a percentage of carrying value
Collectively evaluated for impairment
Allowance for loan and lease losses
Carrying value (3, 4)
Allowance as a percentage of carrying value (4)
Purchased credit-impaired loans
Valuation allowance
Carrying value gross of valuation allowance
Valuation allowance as a percentage of carrying value
Total
Allowance for loan and lease losses
Carrying value (3, 4)
Allowance as a percentage of carrying value (4)
December 31, 2010
$ 1,871
13,904
13.46%
$ 10,964
358,765
3.06%
$ 6,417
36,393
17.63%
$ 19,252
409,062
4.71%
$ 4,786
11,421
41.91%
$ 10,677
222,967
4.79%
n/a
n/a
n/a
$ 15,463
234,388
6.60%
$ 1,080
10,645
10.15%
$ 6,078
282,820
2.15%
$12
204
5.76%
$ 7,170
293,669
2.44%
$7,737
35,970
21.51%
$ 27,719
864,552
3.21%
$6,429
36,597
17.57%
$ 41,885
937,119
4.47%
(1) Impaired loans include nonperforming commercial loans and all TDRs, including both commercial and consumer TDRs. Impaired loans exclude nonperforming consumer loans unless they are classified
as TDRs, and all consumer and commercial loans accounted for under the fair value option.
(2) Commercial impaired allowance for loan and lease losses includes $172 million and $445 million at December 31, 2011 and 2010 related to U.S. small business commercial renegotiated TDR
loans.
(3) Amounts are presented gross of the allowance for loan and lease losses.
(4) Outstanding loan and lease balances and ratios do not include loans accounted for under the fair value option of $8.8 billion and $3.3 billion at December 31, 2011 and 2010.
n/a = not applicable