Bank of America 2011 Annual Report Download - page 268
Download and view the complete annual report
Please find page 268 of the 2011 Bank of America annual report below. You can navigate through the pages in the report by either clicking on the pages listed below, or by using the keyword search tool below to find specific information within the annual report.-
 1
1 -
2
-
3
-
4
-
5
-
6
-
7
-
8
-
9
-
10
-
11
-
12
-
13
-
14
-
15
-
16
-
17
-
18
-
19
-
20
-
21
-
22
-
23
-
24
-
25
-
26
-
27
-
28
-
29
-
30
-
31
-
32
-
33
-
34
-
35
-
36
-
37
-
38
-
39
-
40
-
41
-
42
-
43
-
44
-
45
-
46
-
47
-
48
-
49
-
50
-
51
-
52
-
53
-
54
-
55
-
56
-
57
-
58
-
59
-
60
-
61
-
62
-
63
-
64
-
65
-
66
-
67
-
68
-
69
-
70
-
71
-
72
-
73
-
74
-
75
-
76
-
77
-
78
-
79
-
80
-
81
-
82
-
83
-
84
-
85
-
86
-
87
-
88
-
89
-
90
-
91
-
92
-
93
-
94
-
95
-
96
-
97
-
98
-
99
-
100
-
101
-
102
-
103
-
104
-
105
-
106
-
107
-
108
-
109
-
110
-
111
-
112
-
113
-
114
-
115
-
116
-
117
-
118
-
119
-
120
-
121
-
122
-
123
-
124
-
125
-
126
-
127
-
128
-
129
-
130
-
131
-
132
-
133
-
134
-
135
-
136
-
137
-
138
-
139
-
140
-
141
-
142
-
143
-
144
-
145
-
146
-
147
-
148
-
149
-
150
-
151
-
152
-
153
-
154
-
155
-
156
-
157
-
158
-
159
-
160
-
161
-
162
-
163
-
164
-
165
-
166
-
167
-
168
-
169
-
170
-
171
-
172
-
173
-
174
-
175
-
176
-
177
-
178
-
179
-
180
-
181
-
182
-
183
-
184
-
185
-
186
-
187
-
188
-
189
-
190
-
191
-
192
-
193
-
194
-
195
-
196
-
197
-
198
-
199
-
200
-
201
-
202
-
203
-
204
-
205
-
206
-
207
-
208
-
209
-
210
-
211
-
212
-
213
-
214
-
215
-
216
-
217
-
218
-
219
-
220
-
221
-
222
-
223
-
224
-
225
-
226
-
227
-
228
-
229
-
230
-
231
-
232
-
233
-
234
-
235
-
236
-
237
-
238
-
239
-
240
-
241
-
242
-
243
-
244
-
245
-
246
-
247
-
248
-
249
-
250
-
251
-
252
-
253
-
254
-
255
-
256
-
257
-
 258
258 -
 259
259 -
 260
260 -
 261
261 -
 262
262 -
 263
263 -
 264
264 -
 265
265 -
 266
266 -
 267
267 -
 268
268 -
 269
269 -
 270
270 -
 271
271 -
 272
272 -
 273
273 -
 274
274 -
 275
275 -
 276
276
 |
 |

266 Bank of America 2011
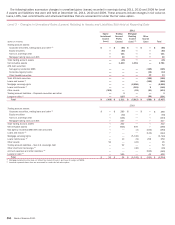
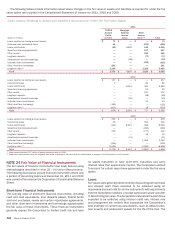
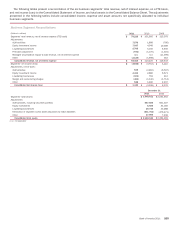
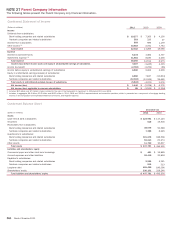
NOTE 27 Parent Company Information
The following tables present the Parent Company only financial information.
Condensed Statement of Income
(Dollars in millions)
Income
Dividends from subsidiaries:
Bank holding companies and related subsidiaries
Nonbank companies and related subsidiaries
Interest from subsidiaries
Other income (1)
Total income
Expense
Interest on borrowed funds
Noninterest expense (2)
Total expense
Income (loss) before income taxes and equity in undistributed earnings of subsidiaries
Income tax benefit
Income before equity in undistributed earnings of subsidiaries
Equity in undistributed earnings (losses) of subsidiaries:
Bank holding companies and related subsidiaries
Nonbank companies and related subsidiaries
Total equity in undistributed earnings (losses) of subsidiaries
Net income (loss)
Net income (loss) applicable to common shareholders
2011
$ 10,277
553
869
10,603
22,302
6,234
11,861
18,095
4,207
(2,783)
6,990
6,650
(12,194)
(5,544)
$ 1,446
$85
2010
$ 7,263
226
999
2,781
11,269
4,484
8,030
12,514
(1,245)
(3,709)
2,464
7,647
(12,349)
(4,702)
$ (2,238)
$ (3,595)
2009
$ 4,100
27
1,179
7,784
13,090
4,737
4,238
8,975
4,115
(85)
4,200
(21,614)
23,690
2,076
$ 6,276
$ (2,204)
(1) Includes $6.5 billion and $7.3 billion of gains related to the sale of the Corporation’s investment in CCB during 2011 and 2009.
(2) Includes, in aggregate, $6.9 billion, $3.5 billion and $225 million in 2011, 2010 and 2009 of representations and warranties provision, which is presented as a component of mortgage banking
income on the Corporation’s Consolidated Statement of Income, and litigation expense.
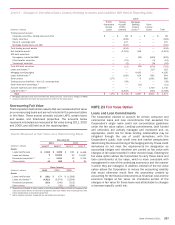
Condensed Balance Sheet
(Dollars in millions)
Assets
Cash held at bank subsidiaries
Securities
Receivables from subsidiaries:
Bank holding companies and related subsidiaries
Nonbank companies and related subsidiaries
Investments in subsidiaries:
Bank holding companies and related subsidiaries
Nonbank companies and related subsidiaries
Other assets
Total assets
Liabilities and shareholders’ equity
Commercial paper and other short-term borrowings
Accrued expenses and other liabilities
Payables to subsidiaries:
Bank holding companies and related subsidiaries
Nonbank companies and related subsidiaries
Long-term debt
Shareholders’ equity
Total liabilities and shareholders’ equity
December 31
2011
$ 124,991
515
48,679
7,385
191,278
53,213
11,720
$ 437,781
$401
22,419
2,925
515
181,420
230,101
$ 437,781
2010
$ 117,124
19,518
50,589
8,320
188,538
61,374
10,837
$ 456,300
$ 13,899
22,803
4,241
513
186,596
228,248
$ 456,300