Bank of America 2011 Annual Report Download - page 105
Download and view the complete annual report
Please find page 105 of the 2011 Bank of America annual report below. You can navigate through the pages in the report by either clicking on the pages listed below, or by using the keyword search tool below to find specific information within the annual report.-
 1
1 -
2
-
3
-
4
-
5
-
6
-
7
-
8
-
9
-
10
-
11
-
12
-
13
-
14
-
15
-
16
-
17
-
18
-
19
-
20
-
21
-
22
-
23
-
24
-
25
-
26
-
27
-
28
-
29
-
30
-
31
-
32
-
33
-
34
-
35
-
36
-
37
-
38
-
39
-
40
-
41
-
42
-
43
-
44
-
45
-
46
-
47
-
48
-
49
-
50
-
51
-
52
-
53
-
54
-
55
-
56
-
57
-
58
-
59
-
60
-
61
-
62
-
63
-
64
-
65
-
66
-
67
-
68
-
69
-
70
-
71
-
72
-
73
-
74
-
75
-
76
-
77
-
78
-
79
-
80
-
81
-
82
-
83
-
84
-
85
-
86
-
87
-
88
-
89
-
90
-
91
-
92
-
93
-
94
-
 95
95 -
 96
96 -
 97
97 -
 98
98 -
 99
99 -
 100
100 -
 101
101 -
 102
102 -
 103
103 -
 104
104 -
 105
105 -
 106
106 -
 107
107 -
 108
108 -
 109
109 -
 110
110 -
 111
111 -
 112
112 -
 113
113 -
 114
114 -
 115
115 -
116
-
117
-
118
-
119
-
120
-
121
-
122
-
123
-
124
-
125
-
126
-
127
-
128
-
129
-
130
-
131
-
132
-
133
-
134
-
135
-
136
-
137
-
138
-
139
-
140
-
141
-
142
-
143
-
144
-
145
-
146
-
147
-
148
-
149
-
150
-
151
-
152
-
153
-
154
-
155
-
156
-
157
-
158
-
159
-
160
-
161
-
162
-
163
-
164
-
165
-
166
-
167
-
168
-
169
-
170
-
171
-
172
-
173
-
174
-
175
-
176
-
177
-
178
-
179
-
180
-
181
-
182
-
183
-
184
-
185
-
186
-
187
-
188
-
189
-
190
-
191
-
192
-
193
-
194
-
195
-
196
-
197
-
198
-
199
-
200
-
201
-
202
-
203
-
204
-
205
-
206
-
207
-
208
-
209
-
210
-
211
-
212
-
213
-
214
-
215
-
216
-
217
-
218
-
219
-
220
-
221
-
222
-
223
-
224
-
225
-
226
-
227
-
228
-
229
-
230
-
231
-
232
-
233
-
234
-
235
-
236
-
237
-
238
-
239
-
240
-
241
-
242
-
243
-
244
-
245
-
246
-
247
-
248
-
249
-
250
-
251
-
252
-
253
-
254
-
255
-
256
-
257
-
258
-
259
-
260
-
261
-
262
-
263
-
264
-
265
-
266
-
267
-
268
-
269
-
270
-
271
-
272
-
273
-
274
-
275
-
276
 |
 |
Bank of America 2011 103
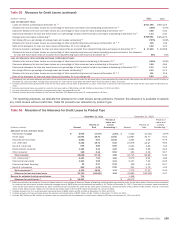
Allowance for Credit Losses
Allowance for Loan and Lease Losses
The allowance for loan and lease losses is comprised of two
components, as described below. We evaluate the adequacy of
the allowance for loan and lease losses based on the total of these
two components. The allowance for loan and lease losses excludes
LHFS and loans accounted for under the fair value option as the
fair value reflects a credit risk component.
The first component of the allowance for loan and lease losses
covers nonperforming commercial loans and performing
commercial loans that have been modified in a TDR, consumer
real estate loans that have been modified in a TDR, renegotiated
credit card, and renegotiated unsecured consumer and small
business loans. These loans are subject to impairment
measurement based on the present value of expected future cash
flows discounted at the loan’s original effective interest rate, or in
certain circumstances, impairment may also be based upon the
collateral value or the loan’s observable market price if available.
Impairment measurement for the renegotiated credit card,
unsecured consumer and small business TDR portfolios is based
on the present value of projected cash flows discounted using the
average portfolio contractual interest rate, excluding promotionally
priced loans, in effect prior to restructuring and prior to any risk-
based or penalty-based increase in rate on the restructured loans.
For purposes of computing this specific loss component of the
allowance, larger impaired loans are evaluated individually and
smaller impaired loans are evaluated as a pool using historical
loss experience for the respective product types and risk ratings
of the loans.
The second component of the allowance for loan and lease
losses covers the remaining consumer and commercial loans and
leases that have incurred losses but are not yet individually
identifiable. The allowance for consumer and certain
homogeneous commercial loan and lease products is based on
aggregated portfolio evaluations, generally by product type. Loss
forecast models are utilized that consider a variety of factors
including, but not limited to, historical loss experience, estimated
defaults or foreclosures based on portfolio trends, delinquencies,
economic trends and credit scores. Our consumer real estate loss
forecast model estimates the portion of loans that will default
based on individual loan attributes, the most significant of which
are refreshed LTV or CLTV, and borrower credit score as well as
vintage and geography, all of which are further broken down into
current delinquency status. Incorporating refreshed LTV and CLTV
into our probability of default allows us to factor the impact of
changes in home prices into our allowance for loan and lease
losses. These loss forecast models are updated on a quarterly
basis to incorporate information reflecting the current economic
environment. As of December 31, 2011, the loss forecast process
resulted in reductions in the allowance for most consumer
portfolios, particularly the credit card and direct/indirect
portfolios.
The allowance for commercial loan and lease losses is
established by product type after analyzing historical loss
experience by internal risk rating, current economic conditions,
industry performance trends, geographic and obligor
concentrations within each portfolio and any other pertinent
information. The statistical models for commercial loans are
generally updated annually and utilize our historical database of
actual defaults and other data. The loan risk ratings and
composition of the commercial portfolios are updated at least
quarterly to incorporate the most recent data reflecting the current
economic environment. For risk-rated commercial loans, we
estimate the probability of default and the LGD based on our
historical experience of defaults and credit losses. Factors
considered when assessing the internal risk rating include the
value of the underlying collateral, if applicable, the industry in which
the obligor operates, the obligor’s liquidity and other financial
indicators, and other quantitative and qualitative factors relevant
to the obligor’s credit risk. When estimating the allowance for loan
and lease losses, management relies not only on models derived
from historical experience but also on its judgment in considering
the effect on probable losses inherent in the portfolios due to the
current macroeconomic environment and trends, inherent
uncertainty in models and other qualitative factors. As of
December 31, 2011, updates to the loan risk ratings and portfolio
composition resulted in reductions in the allowance for all
commercial portfolios.
Also included within this second component of the allowance
for loan and lease losses and determined separately from the
procedures outlined above are reserves that are maintained to
cover uncertainties that affect our estimate of probable losses
including domestic and global economic uncertainty, large single
name defaults, significant events which could disrupt financial
markets and model imprecision.
We monitor differences between estimated and actual incurred
loan and lease losses. This monitoring process includes periodic
assessments by senior management of loan and lease portfolios
and the models used to estimate incurred losses in those
portfolios.
Additions to, or reductions of, the allowance for loan and lease
losses generally are recorded through charges or credits to the
provision for credit losses. Credit exposures deemed to be
uncollectible are charged against the allowance for loan and lease
losses. Recoveries of previously charged off amounts are credited
to the allowance for loan and lease losses.
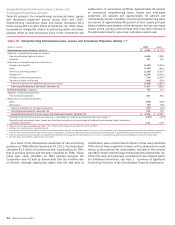
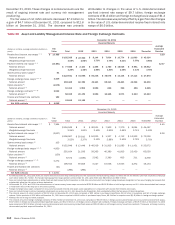
The allowance for loan and lease losses for the consumer
portfolio as presented in Table 56 was $29.6 billion at
December 31, 2011, a decrease of $5.1 billion from
December 31, 2010. This decrease was primarily due to improving
economic conditions and improvement in the current and projected
levels of delinquencies, collections and bankruptcies in the U.S.
consumer credit card and unsecured consumer lending portfolios.
With respect to the consumer PCI loan portfolios, updates to our
expected cash flows resulted in an increase in reserves through
provision of $2.2 billion in 2011, within the discontinued real
estate, home equity and residential mortgage portfolios, primarily
due to our updated home price outlook. Reserve increases related
to the consumer PCI loan portfolios in 2010 were also $2.2 billion.
The allowance for loan and lease losses for the commercial
portfolio was $4.1 billion at December 31, 2011, a $3.0 billion
decrease from December 31, 2010. The decrease was driven by
improvement in the economy and the resulting impact on property
values in the commercial real estate portfolio, improvement in
projected delinquencies in the U.S. small business commercial
portfolio, mostly within Card Services, and stronger borrower credit
profiles in the U.S. commercial portfolios, primarily in Global
Commercial Banking and GBAM.
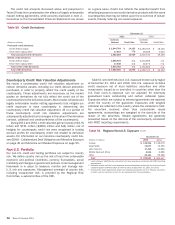
The allowance for loan and lease losses as a percentage of
total loans and leases outstanding was 3.68 percent at
December 31, 2011 compared to 4.47 percent at December 31,
2010. The decrease in the ratio was largely due to improved credit
quality and economic conditions which led to the reduction in the