Bank of America 2011 Annual Report Download - page 30
Download and view the complete annual report
Please find page 30 of the 2011 Bank of America annual report below. You can navigate through the pages in the report by either clicking on the pages listed below, or by using the keyword search tool below to find specific information within the annual report.-
 1
1 -
2
-
3
-
4
-
5
-
6
-
7
-
8
-
9
-
10
-
11
-
12
-
13
-
14
-
15
-
16
-
17
-
18
-
19
-
 20
20 -
 21
21 -
 22
22 -
 23
23 -
 24
24 -
 25
25 -
 26
26 -
 27
27 -
 28
28 -
 29
29 -
 30
30 -
 31
31 -
 32
32 -
 33
33 -
 34
34 -
 35
35 -
 36
36 -
 37
37 -
 38
38 -
 39
39 -
 40
40 -
41
-
42
-
43
-
44
-
45
-
46
-
47
-
48
-
49
-
50
-
51
-
52
-
53
-
54
-
55
-
56
-
57
-
58
-
59
-
60
-
61
-
62
-
63
-
64
-
65
-
66
-
67
-
68
-
69
-
70
-
71
-
72
-
73
-
74
-
75
-
76
-
77
-
78
-
79
-
80
-
81
-
82
-
83
-
84
-
85
-
86
-
87
-
88
-
89
-
90
-
91
-
92
-
93
-
94
-
95
-
96
-
97
-
98
-
99
-
100
-
101
-
102
-
103
-
104
-
105
-
106
-
107
-
108
-
109
-
110
-
111
-
112
-
113
-
114
-
115
-
116
-
117
-
118
-
119
-
120
-
121
-
122
-
123
-
124
-
125
-
126
-
127
-
128
-
129
-
130
-
131
-
132
-
133
-
134
-
135
-
136
-
137
-
138
-
139
-
140
-
141
-
142
-
143
-
144
-
145
-
146
-
147
-
148
-
149
-
150
-
151
-
152
-
153
-
154
-
155
-
156
-
157
-
158
-
159
-
160
-
161
-
162
-
163
-
164
-
165
-
166
-
167
-
168
-
169
-
170
-
171
-
172
-
173
-
174
-
175
-
176
-
177
-
178
-
179
-
180
-
181
-
182
-
183
-
184
-
185
-
186
-
187
-
188
-
189
-
190
-
191
-
192
-
193
-
194
-
195
-
196
-
197
-
198
-
199
-
200
-
201
-
202
-
203
-
204
-
205
-
206
-
207
-
208
-
209
-
210
-
211
-
212
-
213
-
214
-
215
-
216
-
217
-
218
-
219
-
220
-
221
-
222
-
223
-
224
-
225
-
226
-
227
-
228
-
229
-
230
-
231
-
232
-
233
-
234
-
235
-
236
-
237
-
238
-
239
-
240
-
241
-
242
-
243
-
244
-
245
-
246
-
247
-
248
-
249
-
250
-
251
-
252
-
253
-
254
-
255
-
256
-
257
-
258
-
259
-
260
-
261
-
262
-
263
-
264
-
265
-
266
-
267
-
268
-
269
-
270
-
271
-
272
-
273
-
274
-
275
-
276
 |
 |

28 Bank of America 2011
related servicing. Additionally, professional fees increased $686
million related to consulting fees for regulatory initiatives as well
as higher legal expenses. Other general operating expenses
increased $4.9 billion largely as a result of a $3.0 billion increase
in litigation expense, primarily mortgage-related, and an increase
of $1.6 billion in mortgage-related assessments and waivers
costs. Merger and restructuring expenses decreased $1.2 billion
in 2011.
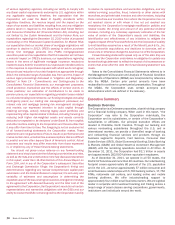
Income Tax Expense
The income tax benefit was $1.7 billion on the pre-tax loss of $230
million for 2011 compared to income tax expense of $915 million
on the pre-tax loss of $1.3 billion for 2010. These amounts are
before FTE adjustments. The effective tax rate for 2011 was not
meaningful due to a small pre-tax loss, and for 2010, due to the
impact of non-deductible goodwill impairment charges of $12.4
billion.
The income tax benefit for 2011 was driven by recurring tax
preference items, such as tax-exempt income and affordable
housing credits, a $1.0 billion benefit from the release of the
remaining valuation allowance applicable to the Merrill Lynch
capital loss carryover deferred tax asset, and a benefit of $823
million for planned realization of previously unrecognized deferred
tax assets related to the tax basis in certain subsidiaries. These
benefits were partially offset by the $782 million tax charge for
the U.K. corporate income tax rate reductions referred to below.
The $3.2 billion of goodwill impairment charges recorded in 2011
were non-deductible.
The effective tax rate for 2010 excluding goodwill impairment
charges from pre-tax income was 8.3 percent. In addition to our
recurring tax preference items, this rate was driven by a $1.7 billion
benefit from the release of a portion of the valuation allowance
applicable to the Merrill Lynch capital loss carryover deferred tax
asset, partially offset by the $392 million charge from a one
percent reduction to the U.K. corporate income tax rate enacted
during 2010.
On July 19, 2011, the U.K. 2011 Finance Bill was enacted
which reduced the corporate income tax rate one percent to 26
percent beginning on April 1, 2011, and then to 25 percent effective
April 1, 2012. These rate reductions will favorably affect income
tax expense on future U.K. earnings but also required us to
remeasure our U.K. net deferred tax assets using the lower tax
rates. As noted above, the income tax benefit for 2011 included
a $782 million charge for the remeasurement, substantially all of
which was recorded in GBAM. If corporate income tax rates were
to be reduced to 23 percent by 2014 as suggested in U.K. Treasury
announcements and assuming no change in the deferred tax asset
balance, a charge to income tax expense of approximately $400
million for each one percent reduction in the rate would result in
each period of enactment (for a total of approximately $800
million).
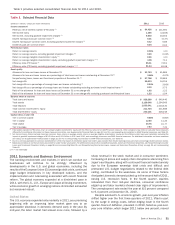
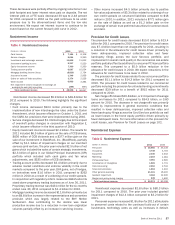
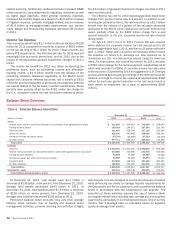
Balance Sheet Overview
Table 6
(Dollars in millions)
Assets
Federal funds sold and securities borrowed or purchased under agreements to resell
Trading account assets
Debt securities
Loans and leases
Allowance for loan and lease losses
All other assets
Total assets
Liabilities
Deposits
Federal funds purchased and securities loaned or sold under agreements to repurchase
Trading account liabilities
Commercial paper and other short-term borrowings
Long-term debt
All other liabilities
Total liabilities
Shareholders’ equity
Total liabilities and shareholders’ equity
Selected Balance Sheet Data
December 31
2011
$ 211,183
169,319
311,416
926,200
(33,783)
544,711
$ 2,129,046
$ 1,033,041
214,864
60,508
35,698
372,265
182,569
1,898,945
230,101
$ 2,129,046
2010
$209,616
194,671
338,054
940,440
(41,885)
624,013
$ 2,264,909
$ 1,010,430
245,359
71,985
59,962
448,431
200,494
2,036,661
228,248
$ 2,264,909
Average Balance
2011
$ 245,069
187,340
337,120
938,096
(37,623)
626,320
$2,296,322
$1,035,802
272,375
84,689
51,894
421,229
201,238
2,067,227
229,095
$2,296,322
2010
$ 256,943
213,745
323,946
958,331
(45,619)
732,260
$ 2,439,606
$ 988,586
353,653
91,669
76,676
490,497
205,290
2,206,371
233,235
$ 2,439,606
At December 31, 2011, total assets were $2.1 trillion, a
decrease of $136 billion, or six percent, from December 31, 2010.
Average total assets decreased $143 billion in 2011. At
December 31, 2011, total liabilities were $1.9 trillion, a decrease
of $138 billion, or seven percent, from December 31, 2010.
Average total liabilities decreased $139 billion in 2011.
Period-end balance sheet amounts may vary from average
balance sheet amounts due to liquidity and balance sheet
management activities, primarily involving our portfolios of highly
liquid assets, that are designed to ensure the adequacy of capital
while enhancing our ability to manage liquidity requirements for
the Corporation and for our customers, and to position the balance
sheet in accordance with the Corporation’s risk appetite. The
execution of these activities requires the use of balance sheet
and capital-related limits including spot, average and risk-weighted
asset limits, particularly in our trading businesses. One of our key
metrics, Tier 1 leverage ratio, is calculated based on adjusted
quarterly average total assets.