Bank of America 2011 Annual Report Download - page 211
Download and view the complete annual report
Please find page 211 of the 2011 Bank of America annual report below. You can navigate through the pages in the report by either clicking on the pages listed below, or by using the keyword search tool below to find specific information within the annual report.-
 1
1 -
2
-
3
-
4
-
5
-
6
-
7
-
8
-
9
-
10
-
11
-
12
-
13
-
14
-
15
-
16
-
17
-
18
-
19
-
20
-
21
-
22
-
23
-
24
-
25
-
26
-
27
-
28
-
29
-
30
-
31
-
32
-
33
-
34
-
35
-
36
-
37
-
38
-
39
-
40
-
41
-
42
-
43
-
44
-
45
-
46
-
47
-
48
-
49
-
50
-
51
-
52
-
53
-
54
-
55
-
56
-
57
-
58
-
59
-
60
-
61
-
62
-
63
-
64
-
65
-
66
-
67
-
68
-
69
-
70
-
71
-
72
-
73
-
74
-
75
-
76
-
77
-
78
-
79
-
80
-
81
-
82
-
83
-
84
-
85
-
86
-
87
-
88
-
89
-
90
-
91
-
92
-
93
-
94
-
95
-
96
-
97
-
98
-
99
-
100
-
101
-
102
-
103
-
104
-
105
-
106
-
107
-
108
-
109
-
110
-
111
-
112
-
113
-
114
-
115
-
116
-
117
-
118
-
119
-
120
-
121
-
122
-
123
-
124
-
125
-
126
-
127
-
128
-
129
-
130
-
131
-
132
-
133
-
134
-
135
-
136
-
137
-
138
-
139
-
140
-
141
-
142
-
143
-
144
-
145
-
146
-
147
-
148
-
149
-
150
-
151
-
152
-
153
-
154
-
155
-
156
-
157
-
158
-
159
-
160
-
161
-
162
-
163
-
164
-
165
-
166
-
167
-
168
-
169
-
170
-
171
-
172
-
173
-
174
-
175
-
176
-
177
-
178
-
179
-
180
-
181
-
182
-
183
-
184
-
185
-
186
-
187
-
188
-
189
-
190
-
191
-
192
-
193
-
194
-
195
-
196
-
197
-
198
-
199
-
200
-
 201
201 -
 202
202 -
 203
203 -
 204
204 -
 205
205 -
 206
206 -
 207
207 -
 208
208 -
 209
209 -
 210
210 -
 211
211 -
 212
212 -
 213
213 -
 214
214 -
 215
215 -
 216
216 -
 217
217 -
 218
218 -
 219
219 -
 220
220 -
 221
221 -
222
-
223
-
224
-
225
-
226
-
227
-
228
-
229
-
230
-
231
-
232
-
233
-
234
-
235
-
236
-
237
-
238
-
239
-
240
-
241
-
242
-
243
-
244
-
245
-
246
-
247
-
248
-
249
-
250
-
251
-
252
-
253
-
254
-
255
-
256
-
257
-
258
-
259
-
260
-
261
-
262
-
263
-
264
-
265
-
266
-
267
-
268
-
269
-
270
-
271
-
272
-
273
-
274
-
275
-
276
 |
 |

Bank of America 2011 209
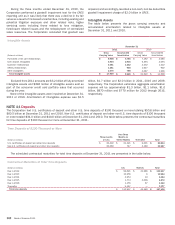
NOTE 12 Federal Funds Sold, Securities Borrowed or Purchased Under Agreements to Resell and
Short-term Borrowings
The table below presents federal funds sold and securities borrowed or purchased under agreements to resell and short-term borrowings
which include federal funds purchased, securities loaned or sold under agreements to repurchase, commercial paper and other short-
term borrowings.
(Dollars in millions)
Federal funds sold and securities borrowed or purchased under agreements to resell
At December 31
Average during year
Maximum month-end balance during year
Federal funds purchased
At December 31
Average during year
Maximum month-end balance during year
Securities loaned or sold under agreements to repurchase
At December 31
Average during year
Maximum month-end balance during year
Commercial paper
At December 31
Average during year
Maximum month-end balance during year
Other short-term borrowings
At December 31
Average during year
Maximum month-end balance during year
2011
Amount
$ 211,183
245,069
270,473
243
1,658
4,133
214,621
270,718
293,519
23
8,897
21,212
35,675
42,996
47,087
Rate
0.76%
0.88
n/a
0.06
0.08
n/a
1.08
1.31
n/a
1.70
0.53
n/a
2.35
2.31
n/a
2010
Amount
$209,616
256,943
314,932
1,458
4,718
8,320
243,901
348,936
458,532
15,093
25,923
36,236
44,869
50,752
63,081
Rate
0.85%
0.71
n/a
0.14
0.15
n/a
1.15
0.74
n/a
0.65
0.56
n/a
2.02
1.88
n/a
2009
Amount
$189,933
235,764
271,321
4,814
4,239
4,814
250,371
365,624
407,967
13,131
26,697
37,025
56,393
92,084
169,602
Rate
0.78%
1.23
n/a
0.09
0.05
n/a
0.39
0.96
n/a
0.65
1.03
n/a
1.72
1.87
n/a
n/a = not applicable
Bank of America, N.A. maintains a global program to offer up
to a maximum of $75 billion outstanding at any one time, of bank
notes with fixed or floating rates and maturities of at least seven
days from the date of issue. Short-term bank notes outstanding
under this program totaled $1.4 billion and $14.6 billion at
December 31, 2011 and 2010. These short-term bank notes,
along with Federal Home Loan Bank (FHLB) advances, U.S.
Treasury tax and loan notes, and term federal funds purchased,
are included in commercial paper and other short-term borrowings
on the Consolidated Balance Sheet. See Note 13 – Long-term Debt
for information regarding the long-term notes that have been
issued under the $75 billion bank note program.