Bank of America 2011 Annual Report Download - page 172
Download and view the complete annual report
Please find page 172 of the 2011 Bank of America annual report below. You can navigate through the pages in the report by either clicking on the pages listed below, or by using the keyword search tool below to find specific information within the annual report.-
 1
1 -
2
-
3
-
4
-
5
-
6
-
7
-
8
-
9
-
10
-
11
-
12
-
13
-
14
-
15
-
16
-
17
-
18
-
19
-
20
-
21
-
22
-
23
-
24
-
25
-
26
-
27
-
28
-
29
-
30
-
31
-
32
-
33
-
34
-
35
-
36
-
37
-
38
-
39
-
40
-
41
-
42
-
43
-
44
-
45
-
46
-
47
-
48
-
49
-
50
-
51
-
52
-
53
-
54
-
55
-
56
-
57
-
58
-
59
-
60
-
61
-
62
-
63
-
64
-
65
-
66
-
67
-
68
-
69
-
70
-
71
-
72
-
73
-
74
-
75
-
76
-
77
-
78
-
79
-
80
-
81
-
82
-
83
-
84
-
85
-
86
-
87
-
88
-
89
-
90
-
91
-
92
-
93
-
94
-
95
-
96
-
97
-
98
-
99
-
100
-
101
-
102
-
103
-
104
-
105
-
106
-
107
-
108
-
109
-
110
-
111
-
112
-
113
-
114
-
115
-
116
-
117
-
118
-
119
-
120
-
121
-
122
-
123
-
124
-
125
-
126
-
127
-
128
-
129
-
130
-
131
-
132
-
133
-
134
-
135
-
136
-
137
-
138
-
139
-
140
-
141
-
142
-
143
-
144
-
145
-
146
-
147
-
148
-
149
-
150
-
151
-
152
-
153
-
154
-
155
-
156
-
157
-
158
-
159
-
160
-
161
-
 162
162 -
 163
163 -
 164
164 -
 165
165 -
 166
166 -
 167
167 -
 168
168 -
 169
169 -
 170
170 -
 171
171 -
 172
172 -
 173
173 -
 174
174 -
 175
175 -
 176
176 -
 177
177 -
 178
178 -
 179
179 -
 180
180 -
 181
181 -
 182
182 -
183
-
184
-
185
-
186
-
187
-
188
-
189
-
190
-
191
-
192
-
193
-
194
-
195
-
196
-
197
-
198
-
199
-
200
-
201
-
202
-
203
-
204
-
205
-
206
-
207
-
208
-
209
-
210
-
211
-
212
-
213
-
214
-
215
-
216
-
217
-
218
-
219
-
220
-
221
-
222
-
223
-
224
-
225
-
226
-
227
-
228
-
229
-
230
-
231
-
232
-
233
-
234
-
235
-
236
-
237
-
238
-
239
-
240
-
241
-
242
-
243
-
244
-
245
-
246
-
247
-
248
-
249
-
250
-
251
-
252
-
253
-
254
-
255
-
256
-
257
-
258
-
259
-
260
-
261
-
262
-
263
-
264
-
265
-
266
-
267
-
268
-
269
-
270
-
271
-
272
-
273
-
274
-
275
-
276
 |
 |

170 Bank of America 2011
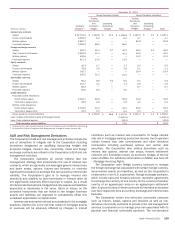
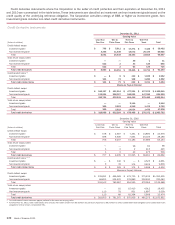
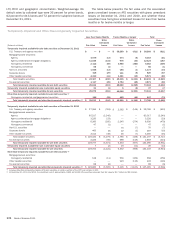
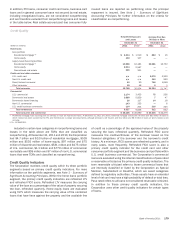
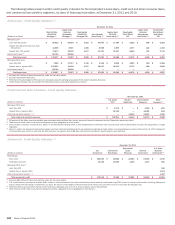
Credit derivative instruments where the Corporation is the seller of credit protection and their expiration at December 31, 2011
and 2010 are summarized in the table below. These instruments are classified as investment and non-investment grade based on the
credit quality of the underlying reference obligation. The Corporation considers ratings of BBB- or higher as investment grade. Non-
investment grade includes non-rated credit derivative instruments.
Credit Derivative Instruments
(Dollars in millions)
Credit default swaps
Investment grade
Non-investment grade
Total
Total return swaps/other
Investment grade
Non-investment grade
Total
Total credit derivatives
Credit-related notes (1)
Investment grade
Non-investment grade
Total credit-related notes
Credit default swaps
Investment grade
Non-investment grade
Total
Total return swaps/other
Investment grade
Non-investment grade
Total
Total credit derivatives
December 31, 2011
Carrying Value
Less than
One Year
$795
4,236
5,031
—
522
522
$ 5,553
$—
124
$124
Maximum Payout/Notional
$ 182,137
133,624
315,761
—
305
305
$ 316,066
One to
Three Years
$ 5,011
11,438
16,449
—
2
2
$ 16,451
$5
74
$79
$ 401,914
228,327
630,241
—
2,023
2,023
$ 632,264
Three to
Five Years
$ 17,271
18,072
35,343
30
33
63
$ 35,406
$132
108
$240
$ 477,924
186,522
664,446
9,116
4,918
14,034
$ 678,480
Over Five
Years
$ 7,325
26,339
33,664
1
128
129
$33,793
$ 1,925
1,286
$ 3,211
$ 127,570
147,926
275,496
—
1,476
1,476
$276,972
Total
$ 30,402
60,085
90,487
31
685
716
$ 91,203
$ 2,062
1,592
$ 3,654
$ 1,189,545
696,399
1,885,944
9,116
8,722
17,838
$ 1,903,782
(Dollars in millions)
Credit default swaps
Investment grade
Non-investment grade
Total
Total return swaps/other
Investment grade
Non-investment grade
Total
Total credit derivatives
Credit-related notes (1, 2)
Investment grade
Non-investment grade
Total credit-related notes
Credit default swaps
Investment grade
Non-investment grade
Total
Total return swaps/other
Investment grade
Non-investment grade
Total
Total credit derivatives
December 31, 2010
Carrying Value
Less than
One Year
$ 158
598
756
—
1
1
$ 757
$—
9
$9
Maximum Payout/Notional
$133,691
84,851
218,542
—
113
113
$218,655
One to
Three Years
$ 2,607
6,630
9,237
—
2
2
$ 9,239
$ 136
33
$ 169
$466,565
314,422
780,987
10
78
88
$781,075
Three to
Five Years
$ 7,331
7,854
15,185
38
2
40
$ 15,225
$—
174
$ 174
$475,715
178,880
654,595
15,413
951
16,364
$670,959
Over Five
Years
$ 14,880
23,106
37,986
60
415
475
$ 38,461
$ 3,525
2,423
$ 5,948
$275,434
203,930
479,364
4,012
1,897
5,909
$485,273
Total
$24,976
38,188
63,164
98
420
518
$ 63,682
$ 3,661
2,639
$ 6,300
$ 1,351,405
782,083
2,133,488
19,435
3,039
22,474
$ 2,155,962
(1) For credit-related notes, maximum payout/notional is the same as carrying value.
(2) For December 31, 2010, total credit-related note amounts have been revised from $3.6 billion (as previously reported) to $6.3 billion to reflect collateralized debt obligations and collateralized loan
obligations held by certain consolidated VIEs.