Bank of America 2011 Annual Report Download - page 31
Download and view the complete annual report
Please find page 31 of the 2011 Bank of America annual report below. You can navigate through the pages in the report by either clicking on the pages listed below, or by using the keyword search tool below to find specific information within the annual report.-
 1
1 -
2
-
3
-
4
-
5
-
6
-
7
-
8
-
9
-
10
-
11
-
12
-
13
-
14
-
15
-
16
-
17
-
18
-
19
-
20
-
 21
21 -
 22
22 -
 23
23 -
 24
24 -
 25
25 -
 26
26 -
 27
27 -
 28
28 -
 29
29 -
 30
30 -
 31
31 -
 32
32 -
 33
33 -
 34
34 -
 35
35 -
 36
36 -
 37
37 -
 38
38 -
 39
39 -
 40
40 -
 41
41 -
42
-
43
-
44
-
45
-
46
-
47
-
48
-
49
-
50
-
51
-
52
-
53
-
54
-
55
-
56
-
57
-
58
-
59
-
60
-
61
-
62
-
63
-
64
-
65
-
66
-
67
-
68
-
69
-
70
-
71
-
72
-
73
-
74
-
75
-
76
-
77
-
78
-
79
-
80
-
81
-
82
-
83
-
84
-
85
-
86
-
87
-
88
-
89
-
90
-
91
-
92
-
93
-
94
-
95
-
96
-
97
-
98
-
99
-
100
-
101
-
102
-
103
-
104
-
105
-
106
-
107
-
108
-
109
-
110
-
111
-
112
-
113
-
114
-
115
-
116
-
117
-
118
-
119
-
120
-
121
-
122
-
123
-
124
-
125
-
126
-
127
-
128
-
129
-
130
-
131
-
132
-
133
-
134
-
135
-
136
-
137
-
138
-
139
-
140
-
141
-
142
-
143
-
144
-
145
-
146
-
147
-
148
-
149
-
150
-
151
-
152
-
153
-
154
-
155
-
156
-
157
-
158
-
159
-
160
-
161
-
162
-
163
-
164
-
165
-
166
-
167
-
168
-
169
-
170
-
171
-
172
-
173
-
174
-
175
-
176
-
177
-
178
-
179
-
180
-
181
-
182
-
183
-
184
-
185
-
186
-
187
-
188
-
189
-
190
-
191
-
192
-
193
-
194
-
195
-
196
-
197
-
198
-
199
-
200
-
201
-
202
-
203
-
204
-
205
-
206
-
207
-
208
-
209
-
210
-
211
-
212
-
213
-
214
-
215
-
216
-
217
-
218
-
219
-
220
-
221
-
222
-
223
-
224
-
225
-
226
-
227
-
228
-
229
-
230
-
231
-
232
-
233
-
234
-
235
-
236
-
237
-
238
-
239
-
240
-
241
-
242
-
243
-
244
-
245
-
246
-
247
-
248
-
249
-
250
-
251
-
252
-
253
-
254
-
255
-
256
-
257
-
258
-
259
-
260
-
261
-
262
-
263
-
264
-
265
-
266
-
267
-
268
-
269
-
270
-
271
-
272
-
273
-
274
-
275
-
276
 |
 |
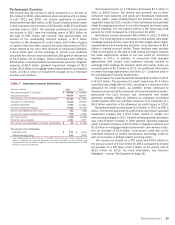
Bank of America 2011 29
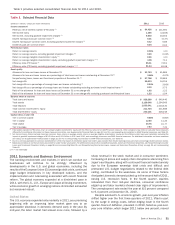
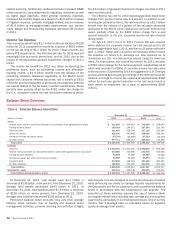
Assets
Federal Funds Sold and Securities Borrowed or
Purchased Under Agreements to Resell
Federal funds transactions involve lending reserve balances on a
short-term basis. Securities borrowed and securities purchased
under agreements to resell are utilized to accommodate customer
transactions, earn interest rate spreads and obtain securities for
settlement. Average federal funds sold and securities borrowed
or purchased under agreements to resell decreased $11.9 billion,
or five percent, in 2011 attributable to an overall decline in balance
sheet usage.
Trading Account Assets
Trading account assets consist primarily of fixed-income securities
including government and corporate debt, and equity and
convertible instruments. Year-end trading account assets
decreased $25.4 billion in 2011 primarily due to actions to reduce
risk on the balance sheet. Average trading account assets
decreased $26.4 billion in 2011 primarily due to a reclassification
of noninterest-earning equity securities from trading account
assets to other assets for average balance sheet purposes.
Debt Securities
Debt securities primarily include U.S. Treasury and agency
securities, MBS, principally agency MBS, foreign bonds, corporate
bonds and municipal debt. We use the debt securities portfolio
primarily to manage interest rate and liquidity risk and to take
advantage of market conditions that create more economically
attractive returns on these investments. Year-end balances of debt
securities decreased $26.6 billion due to agency MBS sales in
2011. Average balances of debt securities increased $13.2 billion
due to agency MBS purchases in the second half of 2010 and the
first three quarters of 2011. For additional information on
available-for-sale (AFS) debt securities, see Note 5 – Securities to
the Consolidated Financial Statements.
Loans and Leases
Year-end and average loans and leases decreased $14.2 billion
to $926.2 billion and $20.2 billion to $938.1 billion in 2011. The
decrease was primarily due to consumer portfolio run-off outpacing
new originations and loan portfolio sales, partially offset by non-
U.S. commercial growth as international demand continues to
remain high. For a more detailed discussion of the loan portfolio,
see Note 6 – Outstanding Loans and Leases to the Consolidated
Financial Statements.
Allowance for Loan and Lease Losses
Year-end and average allowance for loan lease losses decreased
$8.1 billion and $8.0 billion in 2011 primarily due to the impact
of the improving economy partially offset by reserve additions in
the PCI portfolio throughout 2011. For a more detailed discussion
of the Allowance for Loan and Lease Losses, see page 103.
All Other Assets
Year-end and average other assets decreased $79.3 billion and
$105.9 billion in 2011 driven primarily by the sale of strategic
investments, a reduction in loans held-for-sale (LHFS) and lower
mortgage servicing rights (MSRs). Average other assets was also
impacted by lower cash balances held at the Federal Reserve.
Liabilities
Deposits
Year-end and average deposits increased $22.6 billion and $47.2
billion to $1.0 trillion in 2011. The increase was attributable to
growth in our noninterest-bearing deposits.
Federal Funds Purchased and Securities Loaned or Sold
Under Agreements to Repurchase
Federal funds transactions involve borrowing reserve balances on
a short-term basis. Securities loaned and securities sold under
agreements to repurchase are collateralized borrowing
transactions utilized to accommodate customer transactions, earn
interest rate spreads and finance assets on the balance sheet.
Year-end and average federal funds purchased and securities
loaned or sold under agreements to repurchase decreased $30.5
billion and $81.3 billion in 2011 primarily due to planned funding
reductions.
Trading Account Liabilities
Trading account liabilities consist primarily of short positions in
fixed-income securities including government and corporate debt,
equity and convertible instruments. Year-end and average trading
account liabilities decreased $11.5 billion and $7.0 billion in 2011
in line with declines in trading account assets.
Commercial Paper and Other Short-term Borrowings
Commercial paper and other short-term borrowings provide an
additional funding source. Year-end and average commercial paper
and other short-term borrowings decreased $24.3 billion to $35.7
billion and $24.8 billion to $51.9 billion in 2011 due to planned
reductions in wholesale borrowings. During 2011, we reduced to
an insignificant amount our use of unsecured short-term
borrowings including commercial paper and master notes.
Long-term Debt
Year-end and average long-term debt decreased $76.2 billion to
$372.3 billion and $69.3 billion to $421.2 billion in 2011. The
decreases were attributable to the Corporation’s strategy to reduce
our debt footprint. For additional information on long-term debt,
see Note 13 – Long-term Debt to the Consolidated Financial
Statements.
All Other Liabilities
Year-end all other liabilities decreased $17.9 billion in 2011 driven
primarily by a decline in the liability related to collateral held, a
decrease in lower customer margin credits and liquidation of a
consolidated variable interest entity (VIE).
Shareholders’ Equity
Year-end shareholders’ equity increased $1.9 billion. The increase
was driven primarily by the investment by Berkshire, exchanges of
certain preferred securities for common stock and debt and
positive earnings. Average shareholders’ equity decreased $4.1
billion in 2011 primarily driven by losses late in 2010.