Bank of America 2011 Annual Report Download - page 241
Download and view the complete annual report
Please find page 241 of the 2011 Bank of America annual report below. You can navigate through the pages in the report by either clicking on the pages listed below, or by using the keyword search tool below to find specific information within the annual report.-
 1
1 -
2
-
3
-
4
-
5
-
6
-
7
-
8
-
9
-
10
-
11
-
12
-
13
-
14
-
15
-
16
-
17
-
18
-
19
-
20
-
21
-
22
-
23
-
24
-
25
-
26
-
27
-
28
-
29
-
30
-
31
-
32
-
33
-
34
-
35
-
36
-
37
-
38
-
39
-
40
-
41
-
42
-
43
-
44
-
45
-
46
-
47
-
48
-
49
-
50
-
51
-
52
-
53
-
54
-
55
-
56
-
57
-
58
-
59
-
60
-
61
-
62
-
63
-
64
-
65
-
66
-
67
-
68
-
69
-
70
-
71
-
72
-
73
-
74
-
75
-
76
-
77
-
78
-
79
-
80
-
81
-
82
-
83
-
84
-
85
-
86
-
87
-
88
-
89
-
90
-
91
-
92
-
93
-
94
-
95
-
96
-
97
-
98
-
99
-
100
-
101
-
102
-
103
-
104
-
105
-
106
-
107
-
108
-
109
-
110
-
111
-
112
-
113
-
114
-
115
-
116
-
117
-
118
-
119
-
120
-
121
-
122
-
123
-
124
-
125
-
126
-
127
-
128
-
129
-
130
-
131
-
132
-
133
-
134
-
135
-
136
-
137
-
138
-
139
-
140
-
141
-
142
-
143
-
144
-
145
-
146
-
147
-
148
-
149
-
150
-
151
-
152
-
153
-
154
-
155
-
156
-
157
-
158
-
159
-
160
-
161
-
162
-
163
-
164
-
165
-
166
-
167
-
168
-
169
-
170
-
171
-
172
-
173
-
174
-
175
-
176
-
177
-
178
-
179
-
180
-
181
-
182
-
183
-
184
-
185
-
186
-
187
-
188
-
189
-
190
-
191
-
192
-
193
-
194
-
195
-
196
-
197
-
198
-
199
-
200
-
201
-
202
-
203
-
204
-
205
-
206
-
207
-
208
-
209
-
210
-
211
-
212
-
213
-
214
-
215
-
216
-
217
-
218
-
219
-
220
-
221
-
222
-
223
-
224
-
225
-
226
-
227
-
228
-
229
-
230
-
 231
231 -
 232
232 -
 233
233 -
 234
234 -
 235
235 -
 236
236 -
 237
237 -
 238
238 -
 239
239 -
 240
240 -
 241
241 -
 242
242 -
 243
243 -
 244
244 -
 245
245 -
 246
246 -
 247
247 -
 248
248 -
 249
249 -
 250
250 -
 251
251 -
252
-
253
-
254
-
255
-
256
-
257
-
258
-
259
-
260
-
261
-
262
-
263
-
264
-
265
-
266
-
267
-
268
-
269
-
270
-
271
-
272
-
273
-
274
-
275
-
276
 |
 |

Bank of America 2011 239
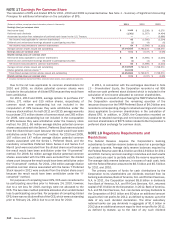
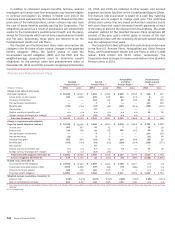
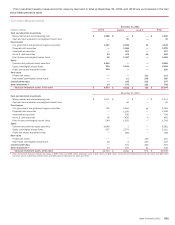
Pre-tax amounts included in accumulated OCI for employee benefit plans at December 31, 2011 and 2010 are presented in the
table below.
Pre-tax Amounts included in Accumulated OCI
(Dollars in millions)
Net actuarial (gain) loss
Transition obligation
Prior service cost (credits)
Amounts recognized in accumulated OCI
Qualified
Pension Plans
2011
$ 6,743
—
67
$ 6,810
2010
$ 5,461
—
98
$ 5,559
Non-U.S.
Pension Plans
2011
$ (212)
—
3
$ (209)
2010
$ (20)
—
1
$ (19)
Nonqualified
and Other
Pension Plans
2011
$409
—
(7)
$402
2010
$ 656
—
(15)
$ 641
Postretirement
Health and
Life Plans
2011
$ (59)
32
33
$6
2010
$ (27)
63
58
$94
Total
2011
$ 6,881
32
96
$ 7,009
2010
$ 6,070
63
142
$ 6,275
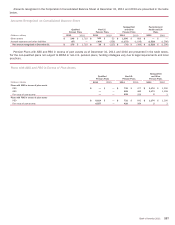
Pre-tax amounts recognized in OCI for employee benefit plans in 2011 included the following components.
Pre-tax Amounts Recognized in OCI
(Dollars in millions)
Other changes in plan assets and benefit obligations recognized in OCI
Current year actuarial (gain) loss
Amortization of actuarial gain (loss)
Current year prior service cost (credit)
Amortization of prior service credit (cost)
Amortization of transition obligation
Amounts recognized in OCI
Qualified
Pension Plans
$ 1,669
(387)
(11)
(20)
—
$ 1,251
Non-U.S.
Pension Plans
$ (192)
—
2
—
—
$ (190)
Nonqualified
and Other
Pension Plans
$ (228)
(19)
—
8
—
$ (239)
Postretirement
Health and
Life Plans
$ (49)
17
(21)
(4)
(31)
$ (88)
Total
$ 1,200
(389)
(30)
(16)
(31)
$ 734
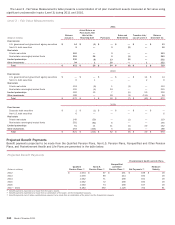
The estimated pre-tax amounts that will be amortized from accumulated OCI into period cost in 2012 are presented in the table
below.
Estimated Pre-tax Amounts from Accumulated OCI into Period
Cost
(Dollars in millions)
Net actuarial (gain) loss
Prior service cost (credit)
Transition obligation
Total amortized from accumulated OCI
Qualified
Pension Plans (1)
$ 598
18
—
$ 616
Non-U.S.
Pension Plans
$ (8)
—
—
$(8)
Nonqualified
and Other
Pension Plans
$10
(7)
—
$3
Postretirement
Health and
Life Plans
$ (19)
4
31
$16
Total
$ 581
15
31
$ 627
(1) Estimates are subject to change based on final calculations related to the pension plan freeze discussed on page 235.
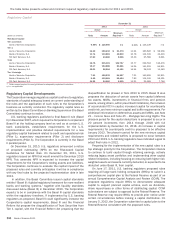
Plan Assets
The Qualified Pension Plans have been established as retirement
vehicles for participants, and trusts have been established to
secure benefits promised under the Qualified Pension Plans. The
Corporation’s policy is to invest the trust assets in a prudent
manner for the exclusive purpose of providing benefits to
participants and defraying reasonable expenses of administration.
The Corporation’s investment strategy is designed to provide a
total return that, over the long term, increases the ratio of assets
to liabilities. The strategy attempts to maximize the investment
return on assets at a level of risk deemed appropriate by the
Corporation while complying with ERISA and any applicable
regulations and laws. The investment strategy utilizes asset
allocation as a principal determinant for establishing the risk/
return profile of the assets. Asset allocation ranges are
established, periodically reviewed and adjusted as funding levels
and liability characteristics change. Active and passive investment
managers are employed to help enhance the risk/return profile of
the assets. An additional aspect of the investment strategy used
to minimize risk (part of the asset allocation plan) includes
matching the equity exposure of participant-selected earnings
measures. For example, the common stock of the Corporation held
in the trust is maintained as an offset to the exposure related to
participants who elected to receive an earnings measure based
on the return performance of common stock of the Corporation.
No plan assets are expected to be returned to the Corporation
during 2012.
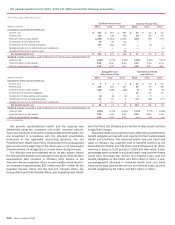
The assets of the Non-U.S. Pension Plans are primarily
attributable to a U.K. pension plan. This U.K. pension plan’s assets
are invested prudently so that the benefits promised to members
are provided with consideration given to the nature and the duration
of the plan’s liabilities. The current planned investment strategy
was set following an asset-liability study and advice from the
trustee’s investment advisors. The selected asset allocation
strategy is designed to achieve a higher return than the lowest
risk strategy while maintaining a prudent approach to meeting the
plan’s liabilities.