Bank of America 2011 Annual Report Download - page 41
Download and view the complete annual report
Please find page 41 of the 2011 Bank of America annual report below. You can navigate through the pages in the report by either clicking on the pages listed below, or by using the keyword search tool below to find specific information within the annual report.-
 1
1 -
2
-
3
-
4
-
5
-
6
-
7
-
8
-
9
-
10
-
11
-
12
-
13
-
14
-
15
-
16
-
17
-
18
-
19
-
20
-
21
-
22
-
23
-
24
-
25
-
26
-
27
-
28
-
29
-
30
-
 31
31 -
 32
32 -
 33
33 -
 34
34 -
 35
35 -
 36
36 -
 37
37 -
 38
38 -
 39
39 -
 40
40 -
 41
41 -
 42
42 -
 43
43 -
 44
44 -
 45
45 -
 46
46 -
 47
47 -
 48
48 -
 49
49 -
 50
50 -
 51
51 -
52
-
53
-
54
-
55
-
56
-
57
-
58
-
59
-
60
-
61
-
62
-
63
-
64
-
65
-
66
-
67
-
68
-
69
-
70
-
71
-
72
-
73
-
74
-
75
-
76
-
77
-
78
-
79
-
80
-
81
-
82
-
83
-
84
-
85
-
86
-
87
-
88
-
89
-
90
-
91
-
92
-
93
-
94
-
95
-
96
-
97
-
98
-
99
-
100
-
101
-
102
-
103
-
104
-
105
-
106
-
107
-
108
-
109
-
110
-
111
-
112
-
113
-
114
-
115
-
116
-
117
-
118
-
119
-
120
-
121
-
122
-
123
-
124
-
125
-
126
-
127
-
128
-
129
-
130
-
131
-
132
-
133
-
134
-
135
-
136
-
137
-
138
-
139
-
140
-
141
-
142
-
143
-
144
-
145
-
146
-
147
-
148
-
149
-
150
-
151
-
152
-
153
-
154
-
155
-
156
-
157
-
158
-
159
-
160
-
161
-
162
-
163
-
164
-
165
-
166
-
167
-
168
-
169
-
170
-
171
-
172
-
173
-
174
-
175
-
176
-
177
-
178
-
179
-
180
-
181
-
182
-
183
-
184
-
185
-
186
-
187
-
188
-
189
-
190
-
191
-
192
-
193
-
194
-
195
-
196
-
197
-
198
-
199
-
200
-
201
-
202
-
203
-
204
-
205
-
206
-
207
-
208
-
209
-
210
-
211
-
212
-
213
-
214
-
215
-
216
-
217
-
218
-
219
-
220
-
221
-
222
-
223
-
224
-
225
-
226
-
227
-
228
-
229
-
230
-
231
-
232
-
233
-
234
-
235
-
236
-
237
-
238
-
239
-
240
-
241
-
242
-
243
-
244
-
245
-
246
-
247
-
248
-
249
-
250
-
251
-
252
-
253
-
254
-
255
-
256
-
257
-
258
-
259
-
260
-
261
-
262
-
263
-
264
-
265
-
266
-
267
-
268
-
269
-
270
-
271
-
272
-
273
-
274
-
275
-
276
 |
 |

Bank of America 2011 39
Compensatory fees are fees that we expect to be assessed
by the government-sponsored enterprises, Fannie Mae (FNMA) and
Freddie Mac (FHLMC) (collectively, the GSEs), as a result of
foreclosure delays pursuant to first mortgage seller/servicer
guides with the GSEs which provide timelines to complete the
liquidation of delinquent loans. In instances where we fail to meet
these timelines, our agreements provide the GSEs with the option
to assess compensatory fees. The remainder of the mortgage-
related assessments and waivers costs are out-of-pocket costs
that we do not expect to recover. We expect these costs will remain
elevated as additional loans are delayed in the foreclosure
process. We also expect that continued elevated costs, including
costs related to resources necessary to perform the foreclosure
process assessments and to implement other operational
changes, will continue.
Average economic capital decreased 30 percent due to a
reduction in credit risk driven by lower loan balances, and the sale
of Balboa. Average allocated equity decreased for the same
reasons as economic capital as well as the goodwill impairment
charges in 2011 and 2010. For more information regarding
economic capital and allocated equity, see Supplemental Financial
Data on page 32.
Mortgage Banking Income
CRES mortgage banking income is categorized into production and
servicing income. Core production income is comprised of revenue
from the fair value gains and losses recognized on our interest
rate lock commitments (IRLCs) and LHFS, the related secondary
market execution, and costs related to representations and
warranties in the sales transactions along with other obligations
incurred in the sales of mortgage loans. In addition, production
income includes revenue, which is offset in All Other, for transfers
of mortgage loans from CRES to the ALM portfolio related to the
Corporation’s mortgage production retention decisions. Ongoing
costs related to representations and warranties and other
obligations that were incurred in the sales of mortgage loans in
prior periods are also included in production income.
Servicing income includes income earned in connection with
servicing activities and MSR valuation adjustments, net of
economic hedge activities. The costs associated with our servicing
activities are included in noninterest expense.
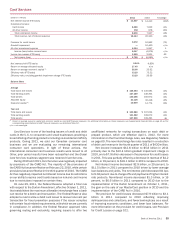
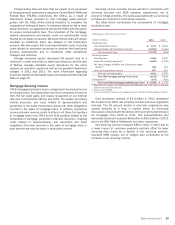
The table below summarizes the components of mortgage
banking income.
Mortgage Banking Income
(Dollars in millions)
Production loss:
Core production revenue
Representations and warranties provision
Total production loss
Servicing income:
Servicing fees
Impact of customer payments (1)
Fair value changes of MSRs, net of economic hedge
results (2)
Other servicing-related revenue
Total net servicing income
Total CRES mortgage banking income (loss)
Eliminations (3)
Total consolidated mortgage banking income (loss)
2011
$ 2,797
(15,591)
(12,794)
5,959
(2,621)
656
607
4,601
(8,193)
(637)
$ (8,830)
2010
$ 6,182
(6,785)
(603)
6,475
(3,759)
376
675
3,767
3,164
(430)
$ 2,734
(1) Represents the change in the market value of the MSR asset due to the impact of customer
payments received during the year.
(2) Includes sale of MSRs.
(3) Includes the effect of transfers of mortgage loans from CRES to the ALM portfolio in All Other.
Core production revenue of $2.8 billion in 2011 decreased
$3.4 billion from 2010 due primarily to lower new loan origination
volumes. The 52 percent decline in new loan originations was
caused primarily by a drop in market share, as previously
discussed, combined with the decline in the overall market demand
for mortgages from 2010 to 2011. The representations and
warranties provision increased $8.8 billion to $15.6 billion in 2011
due to the BNY Mellon Settlement and other exposures.
Net servicing income increased $834 million in 2011 due to
a lower impact of customer payments partially offset by lower
servicing fees driven by a decline in the servicing portfolio.
Improved MSR results, net of hedges also contributed to the
increase in net servicing income.