Bank of America 2011 Annual Report Download - page 90
Download and view the complete annual report
Please find page 90 of the 2011 Bank of America annual report below. You can navigate through the pages in the report by either clicking on the pages listed below, or by using the keyword search tool below to find specific information within the annual report.-
 1
1 -
2
-
3
-
4
-
5
-
6
-
7
-
8
-
9
-
10
-
11
-
12
-
13
-
14
-
15
-
16
-
17
-
18
-
19
-
20
-
21
-
22
-
23
-
24
-
25
-
26
-
27
-
28
-
29
-
30
-
31
-
32
-
33
-
34
-
35
-
36
-
37
-
38
-
39
-
40
-
41
-
42
-
43
-
44
-
45
-
46
-
47
-
48
-
49
-
50
-
51
-
52
-
53
-
54
-
55
-
56
-
57
-
58
-
59
-
60
-
61
-
62
-
63
-
64
-
65
-
66
-
67
-
68
-
69
-
70
-
71
-
72
-
73
-
74
-
75
-
76
-
77
-
78
-
79
-
 80
80 -
 81
81 -
 82
82 -
 83
83 -
 84
84 -
 85
85 -
 86
86 -
 87
87 -
 88
88 -
 89
89 -
 90
90 -
 91
91 -
 92
92 -
 93
93 -
 94
94 -
 95
95 -
 96
96 -
 97
97 -
 98
98 -
 99
99 -
 100
100 -
101
-
102
-
103
-
104
-
105
-
106
-
107
-
108
-
109
-
110
-
111
-
112
-
113
-
114
-
115
-
116
-
117
-
118
-
119
-
120
-
121
-
122
-
123
-
124
-
125
-
126
-
127
-
128
-
129
-
130
-
131
-
132
-
133
-
134
-
135
-
136
-
137
-
138
-
139
-
140
-
141
-
142
-
143
-
144
-
145
-
146
-
147
-
148
-
149
-
150
-
151
-
152
-
153
-
154
-
155
-
156
-
157
-
158
-
159
-
160
-
161
-
162
-
163
-
164
-
165
-
166
-
167
-
168
-
169
-
170
-
171
-
172
-
173
-
174
-
175
-
176
-
177
-
178
-
179
-
180
-
181
-
182
-
183
-
184
-
185
-
186
-
187
-
188
-
189
-
190
-
191
-
192
-
193
-
194
-
195
-
196
-
197
-
198
-
199
-
200
-
201
-
202
-
203
-
204
-
205
-
206
-
207
-
208
-
209
-
210
-
211
-
212
-
213
-
214
-
215
-
216
-
217
-
218
-
219
-
220
-
221
-
222
-
223
-
224
-
225
-
226
-
227
-
228
-
229
-
230
-
231
-
232
-
233
-
234
-
235
-
236
-
237
-
238
-
239
-
240
-
241
-
242
-
243
-
244
-
245
-
246
-
247
-
248
-
249
-
250
-
251
-
252
-
253
-
254
-
255
-
256
-
257
-
258
-
259
-
260
-
261
-
262
-
263
-
264
-
265
-
266
-
267
-
268
-
269
-
270
-
271
-
272
-
273
-
274
-
275
-
276
 |
 |

88 Bank of America 2011
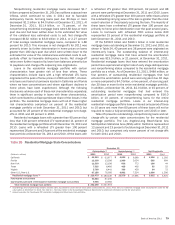
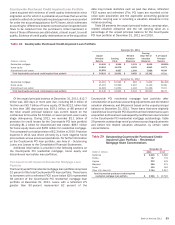
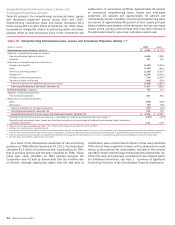
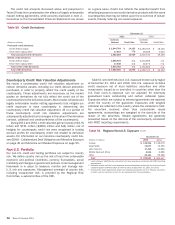
Table 37 presents TDRs for the home loans portfolio. Performing TDR balances are excluded from nonperforming loans in Table
36.
Table 37
(Dollars in millions)
Residential mortgage (1, 2)
Home equity (3)
Discontinued real estate (4)
Total home loans troubled debt restructurings
Home Loans Troubled Debt Restructurings
December 31
2011
Total
$ 19,287
1,776
399
$ 21,462
Nonperforming
$ 5,034
543
214
$ 5,791
Performing
$ 14,253
1,233
185
$ 15,671
2010
Total
$ 11,788
1,721
395
$ 13,904
Nonperforming
$ 3,297
541
206
$ 4,044
Performing
$ 8,491
1,180
189
$ 9,860
(1) Residential mortgage TDRs deemed collateral dependent totaled $5.3 billion and $3.2 billion, and included $2.2 billion and $921 million of loans classified as nonperforming and $3.1 billion and
$2.3 billion of loans classified as performing at December 31, 2011 and 2010.
(2) Residential mortgage performing TDRs included $7.0 billion and $2.5 billion of loans that were fully-insured at December 31, 2011 and 2010.
(3) Home equity TDRs deemed collateral dependent totaled $824 million and $796 million, and included $282 million and $245 million of loans classified as nonperforming and $542 million and $551
million of loans classified as performing at December 31, 2011 and 2010.
(4) Discontinued real estate TDRs deemed collateral dependent totaled $230 million and $213 million, and included $118 million and $97 million of loans classified as nonperforming and $112 million
and $116 million as performing at December 31, 2011 and 2010.
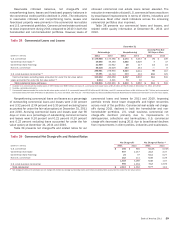
Commercial Portfolio Credit Risk Management
Credit risk management for the commercial portfolio begins with
an assessment of the credit risk profile of the borrower or
counterparty based on an analysis of its financial position. As part
of the overall credit risk assessment, our commercial credit
exposures are assigned a risk rating and are subject to approval
based on defined credit approval standards. Subsequent to loan
origination, risk ratings are monitored on an ongoing basis, and if
necessary, adjusted to reflect changes in the financial condition,
cash flow, risk profile or outlook of a borrower or counterparty. In
making credit decisions, we consider risk rating, collateral, country,
industry and single name concentration limits while also balancing
the total borrower or counterparty relationship. Our business and
risk management personnel use a variety of tools to continuously
monitor the ability of a borrower or counterparty to perform under
its obligations. We use risk rating aggregations to measure and
evaluate concentrations within portfolios. In addition, risk ratings
are a factor in determining the level of assigned economic capital
and the allowance for credit losses.
For information on our accounting policies regarding
delinquencies, nonperforming status and net charge-offs for the
commercial portfolio, see Note 1 – Summary of Significant
Accounting Principles to the Consolidated Financial Statements.
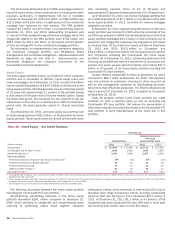
Management of Commercial Credit Risk
Concentrations
Commercial credit risk is evaluated and managed with the goal
that concentrations of credit exposure do not result in undesirable
levels of risk. We review, measure and manage concentrations of
credit exposure by industry, product, geography, customer
relationship and loan size. We also review, measure and manage
commercial real estate loans by geographic location and property
type. In addition, within our international portfolio, we evaluate
exposures by region and by country. Tables 42, 47, 53 and 54
summarize our concentrations. We also utilize syndications of
exposure to third parties, loan sales, hedging and other risk
mitigation techniques to manage the size and risk profile of the
commercial credit portfolio.
As part of our ongoing risk mitigation initiatives, we attempt to
work with clients experiencing financial difficulty to modify their
loans to terms that better align with their current ability to pay. In
situations where an economic concession has been granted to a
borrower experiencing financial difficulty, we identify these loans
as TDRs.
We account for certain large corporate loans and loan
commitments, including issued but unfunded letters of credit
which are considered utilized for credit risk management purposes,
that exceed our single name credit risk concentration guidelines
under the fair value option. Lending commitments, both funded
and unfunded, are actively managed and monitored, and as
appropriate, credit risk for these lending relationships may be
mitigated through the use of credit derivatives, with the
Corporation’s credit view and market perspectives determining the
size and timing of the hedging activity. In addition, we purchase
credit protection to cover the funded portion as well as the
unfunded portion of certain other credit exposures. To lessen the
cost of obtaining our desired credit protection levels, credit
exposure may be added within an industry, borrower or
counterparty group by selling protection. These credit derivatives
do not meet the requirements for treatment as accounting hedges.
They are carried at fair value with changes in fair value recorded
in other income (loss).
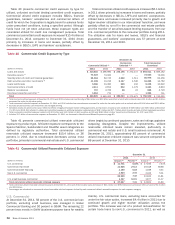
Commercial Credit Portfolio
During 2011, credit quality in the commercial loans portfolio
showed improvement relative to 2010. Commercial loans
increased in 2011 primarily due to growth in commercial and
industrial lending. Non-U.S. commercial loan growth, centered in
corporate loans and trade finance, was driven by higher client
demand, enterprise-wide initiatives, regional economic conditions
and disruption in debt and equity markets leading to higher
utilization. Growth in U.S. commercial loans was driven by
domestic economic momentum. This was partially offset by
declines in commercial real estate loans as net paydowns and
sales outpaced new originations and renewals.