Bank of America 2011 Annual Report Download - page 48
Download and view the complete annual report
Please find page 48 of the 2011 Bank of America annual report below. You can navigate through the pages in the report by either clicking on the pages listed below, or by using the keyword search tool below to find specific information within the annual report.-
 1
1 -
2
-
3
-
4
-
5
-
6
-
7
-
8
-
9
-
10
-
11
-
12
-
13
-
14
-
15
-
16
-
17
-
18
-
19
-
20
-
21
-
22
-
23
-
24
-
25
-
26
-
27
-
28
-
29
-
30
-
31
-
32
-
33
-
34
-
35
-
36
-
37
-
 38
38 -
 39
39 -
 40
40 -
 41
41 -
 42
42 -
 43
43 -
 44
44 -
 45
45 -
 46
46 -
 47
47 -
 48
48 -
 49
49 -
 50
50 -
 51
51 -
 52
52 -
 53
53 -
 54
54 -
 55
55 -
 56
56 -
 57
57 -
 58
58 -
59
-
60
-
61
-
62
-
63
-
64
-
65
-
66
-
67
-
68
-
69
-
70
-
71
-
72
-
73
-
74
-
75
-
76
-
77
-
78
-
79
-
80
-
81
-
82
-
83
-
84
-
85
-
86
-
87
-
88
-
89
-
90
-
91
-
92
-
93
-
94
-
95
-
96
-
97
-
98
-
99
-
100
-
101
-
102
-
103
-
104
-
105
-
106
-
107
-
108
-
109
-
110
-
111
-
112
-
113
-
114
-
115
-
116
-
117
-
118
-
119
-
120
-
121
-
122
-
123
-
124
-
125
-
126
-
127
-
128
-
129
-
130
-
131
-
132
-
133
-
134
-
135
-
136
-
137
-
138
-
139
-
140
-
141
-
142
-
143
-
144
-
145
-
146
-
147
-
148
-
149
-
150
-
151
-
152
-
153
-
154
-
155
-
156
-
157
-
158
-
159
-
160
-
161
-
162
-
163
-
164
-
165
-
166
-
167
-
168
-
169
-
170
-
171
-
172
-
173
-
174
-
175
-
176
-
177
-
178
-
179
-
180
-
181
-
182
-
183
-
184
-
185
-
186
-
187
-
188
-
189
-
190
-
191
-
192
-
193
-
194
-
195
-
196
-
197
-
198
-
199
-
200
-
201
-
202
-
203
-
204
-
205
-
206
-
207
-
208
-
209
-
210
-
211
-
212
-
213
-
214
-
215
-
216
-
217
-
218
-
219
-
220
-
221
-
222
-
223
-
224
-
225
-
226
-
227
-
228
-
229
-
230
-
231
-
232
-
233
-
234
-
235
-
236
-
237
-
238
-
239
-
240
-
241
-
242
-
243
-
244
-
245
-
246
-
247
-
248
-
249
-
250
-
251
-
252
-
253
-
254
-
255
-
256
-
257
-
258
-
259
-
260
-
261
-
262
-
263
-
264
-
265
-
266
-
267
-
268
-
269
-
270
-
271
-
272
-
273
-
274
-
275
-
276
 |
 |

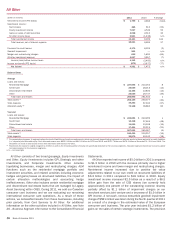
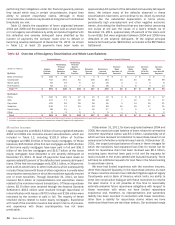
46 Bank of America 2011
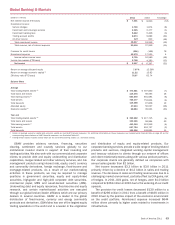
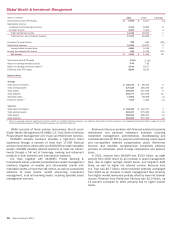
Global Wealth & Investment Management
(Dollars in millions)
Net interest income (FTE basis)
Noninterest income:
Investment and brokerage services
All other income
Total noninterest income
Total revenue, net of interest expense
Provision for credit losses
Noninterest expense
Income before income taxes
Income tax expense (FTE basis)
Net income
Net interest yield (FTE basis)
Return on average allocated equity
Return on average economic capital (1)
Efficiency ratio (FTE basis)
Balance Sheet
Average
Total loans and leases
Total earning assets
Total assets
Total deposits
Allocated equity
Economic capital (1)
Year end
Total loans and leases
Total earning assets
Total assets
Total deposits
2011
$ 6,046
9,310
2,020
11,330
17,376
398
14,395
2,583
948
$ 1,635
2.24%
9.19
23.44
82.84
$ 102,143
270,423
290,357
254,777
17,802
7,106
$ 103,459
263,347
283,844
253,029
2010
$ 5,677
8,660
1,952
10,612
16,289
646
13,227
2,416
1,076
$ 1,340
2.31%
7.42
19.57
81.20
$ 99,269
246,236
267,163
232,318
18,068
7,290
$ 100,724
275,260
296,251
257,982
% Change
6%
8
3
7
7
(38)
9
7
(12)
22
3
10
9
10
(1)
(3)
3
(4)
(4)
(2)
(1) Return on average economic capital and economic capital are non-GAAP financial measures. For additional information on these measures, see Supplemental Financial Data on page 32 and for
corresponding reconciliations to GAAP financial measures, see Statistical Table XVI.
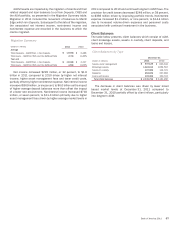
GWIM consists of three primary businesses: Merrill Lynch
Global Wealth Management (MLGWM); U.S. Trust, Bank of America
Private Wealth Management (U.S. Trust); and Retirement Services.
MLGWM’s advisory business provides a high-touch client
experience through a network of more than 17,000 financial
advisors focused on clients with over $250,000 in total investable
assets. MLGWM provides tailored solutions to meet our clients’
needs through a full set of brokerage, banking and retirement
products in both domestic and international locations.
U.S. Trust, together with MLGWM’s Private Banking &
Investments Group, provides comprehensive wealth management
solutions targeted at wealthy and ultra-wealthy clients with
investable assets of more than $5 million, as well as customized
solutions to meet clients’ wealth structuring, investment
management, trust and banking needs, including specialty asset
management services.
Retirement Services partners with financial advisors to provide
institutional and personal retirement solutions including
investment management, administration, recordkeeping and
custodial services for 401(k), pension, profit-sharing, equity award
and non-qualified deferred compensation plans. Retirement
Services also provides comprehensive investment advisory
services to individuals, small to large corporations and pension
plans.
In 2011, revenue from MLGWM was $13.5 billion, up eight
percent from 2010 driven by an increase in asset management
fees, due to higher average market levels, and long-term AUM
flows, as well as higher net interest income. Revenue from
U.S. Trust was $2.7 billion, which remained relatively unchanged
from 2010 as an increase in asset management fees primarily
from higher market levels was partially offset by lower net interest
income. Revenue from Retirement Services was $1.0 billion, up
11 percent compared to 2010 primarily due to higher market
levels.