Bank of America 2011 Annual Report Download - page 58
Download and view the complete annual report
Please find page 58 of the 2011 Bank of America annual report below. You can navigate through the pages in the report by either clicking on the pages listed below, or by using the keyword search tool below to find specific information within the annual report.-
 1
1 -
2
-
3
-
4
-
5
-
6
-
7
-
8
-
9
-
10
-
11
-
12
-
13
-
14
-
15
-
16
-
17
-
18
-
19
-
20
-
21
-
22
-
23
-
24
-
25
-
26
-
27
-
28
-
29
-
30
-
31
-
32
-
33
-
34
-
35
-
36
-
37
-
38
-
39
-
40
-
41
-
42
-
43
-
44
-
45
-
46
-
47
-
 48
48 -
 49
49 -
 50
50 -
 51
51 -
 52
52 -
 53
53 -
 54
54 -
 55
55 -
 56
56 -
 57
57 -
 58
58 -
 59
59 -
 60
60 -
 61
61 -
 62
62 -
 63
63 -
 64
64 -
 65
65 -
 66
66 -
 67
67 -
 68
68 -
69
-
70
-
71
-
72
-
73
-
74
-
75
-
76
-
77
-
78
-
79
-
80
-
81
-
82
-
83
-
84
-
85
-
86
-
87
-
88
-
89
-
90
-
91
-
92
-
93
-
94
-
95
-
96
-
97
-
98
-
99
-
100
-
101
-
102
-
103
-
104
-
105
-
106
-
107
-
108
-
109
-
110
-
111
-
112
-
113
-
114
-
115
-
116
-
117
-
118
-
119
-
120
-
121
-
122
-
123
-
124
-
125
-
126
-
127
-
128
-
129
-
130
-
131
-
132
-
133
-
134
-
135
-
136
-
137
-
138
-
139
-
140
-
141
-
142
-
143
-
144
-
145
-
146
-
147
-
148
-
149
-
150
-
151
-
152
-
153
-
154
-
155
-
156
-
157
-
158
-
159
-
160
-
161
-
162
-
163
-
164
-
165
-
166
-
167
-
168
-
169
-
170
-
171
-
172
-
173
-
174
-
175
-
176
-
177
-
178
-
179
-
180
-
181
-
182
-
183
-
184
-
185
-
186
-
187
-
188
-
189
-
190
-
191
-
192
-
193
-
194
-
195
-
196
-
197
-
198
-
199
-
200
-
201
-
202
-
203
-
204
-
205
-
206
-
207
-
208
-
209
-
210
-
211
-
212
-
213
-
214
-
215
-
216
-
217
-
218
-
219
-
220
-
221
-
222
-
223
-
224
-
225
-
226
-
227
-
228
-
229
-
230
-
231
-
232
-
233
-
234
-
235
-
236
-
237
-
238
-
239
-
240
-
241
-
242
-
243
-
244
-
245
-
246
-
247
-
248
-
249
-
250
-
251
-
252
-
253
-
254
-
255
-
256
-
257
-
258
-
259
-
260
-
261
-
262
-
263
-
264
-
265
-
266
-
267
-
268
-
269
-
270
-
271
-
272
-
273
-
274
-
275
-
276
 |
 |

56 Bank of America 2011
performing their obligations under the financial guaranty policies
they issued which may, in certain circumstances, impact their
ability to present repurchase claims, although in those
circumstances, investors may be able to bring claims if contractual
thresholds are met.
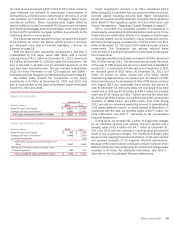
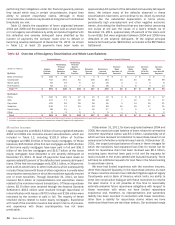
Table 12 details the population of loans originated between
2004 and 2008 and the population of loans sold as whole loans
or in non-agency securitizations by entity and product together with
the defaulted and severely delinquent loans stratified by the
number of payments the borrower made prior to default or
becoming severely delinquent at December 31, 2011. As shown
in Table 12, at least 25 payments have been made on
approximately 63 percent of the defaulted and severely delinquent
loans. We believe many of the defaults observed in these
securitizations have been, and continue to be, driven by external
factors like the substantial depreciation in home prices,
persistently high unemployment and other negative economic
trends, diminishing the likelihood that any loan defect (assuming
one exists at all) was the cause of a loan’s default. As of
December 31, 2011, approximately 25 percent of the loans sold
to non-GSEs that were originated between 2004 and 2008 have
defaulted or are severely delinquent. Of the original principal
balance for Countrywide, $409 billion is included in the BNY Mellon
Settlement.
Table 12
(Dollars in billions)
By Entity
Bank of America
Countrywide
Merrill Lynch
First Franklin
Total (1, 2)
By Product
Prime
Alt-A
Pay option
Subprime
Home Equity
Other
Total
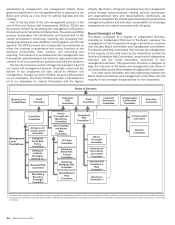
Overview of Non-Agency Securitization and Whole Loan Balances
Principal Balance
Original
Principal
Balance
$ 100
716
65
82
$ 963
$ 302
172
150
245
88
6
$ 963
Outstanding
Principal
Balance
December
31, 2011
$28
252
19
21
$ 320
$ 102
71
56
74
15
2
$ 320
Defaulted or Severely Delinquent
Outstanding
Principal
Balance
180 Days or
More
Past Due
$5
84
6
7
$ 102
$17
20
28
34
1
2
$ 102
Defaulted
Principal
Balance
$4
100
12
21
$ 137
$15
28
28
49
16
1
$ 137
Defaulted or
Severely
Delinquent
$9
184
18
28
$239
$32
48
56
83
17
3
$239
Borrower
Made
less than 13
Payments
$1
24
3
4
$32
$2
7
5
16
2
—
$32
Borrower
Made
13 to 24
Payments
$2
45
4
6
$57
$6
12
14
19
5
1
$57
Borrower
Made
25 to 36
Payments
$2
46
3
5
$56
$7
12
16
17
4
—
$56
Borrower
Made
more than 36
Payments
$4
69
8
13
$94
$17
17
21
31
6
2
$94
(1) Excludes transactions sponsored by Bank of America and Merrill Lynch where no representations or warranties were made.
(2) Includes exposures on third-party sponsored transactions related to legacy entity originations.
Monoline Insurers
Legacy companies sold $184.5 billion of loans originated between
2004 and 2008 into monoline-insured securitizations, which are
included in Table 12, including $103.9 billion of first-lien
mortgages and $80.6 billion of home equity mortgages. Of these
balances, $45.9 billion of the first-lien mortgages and $50.4 billion
of the home equity mortgages have been paid in full and $36.3
billion of the first-lien mortgages and $16.7 billion of the home
equity mortgages have defaulted or are severely delinquent at
December 31, 2011. At least 25 payments have been made on
approximately 60 percent of the defaulted and severely delinquent
loans. Of the first-lien mortgages sold, $39.1 billion, or 38 percent,
were sold as whole loans to other institutions which subsequently
included these loans with those of other originators in private-label
securitization transactions in which the monolines typically insured
one or more securities. Through December 31, 2011, we have
received $6.0 billion of representations and warranties claims
related to the monoline-insured transactions. Of these repurchase
claims, $2.0 billion were resolved through the Assured Guaranty
Settlement, $813 million were resolved through repurchase or
indemnification with losses of $703 million and $138 million were
rescinded by the investor or paid in full. The majority of these
resolved claims related to home equity mortgages. Experience
with most of the monoline insurers has varied in terms of process,
and experience with these counterparties has not been
predictable.
At December 31, 2011, for loans originated between 2004 and
2008, the unpaid principal balance of loans related to unresolved
monoline repurchase claims was $3.1 billion, substantially all of
which we have reviewed and declined to repurchase based on an
assessment of whether a material breach exists. At December 31,
2011, the unpaid principal balance of loans in these vintages for
which the monolines had requested loan files for review but for
which no repurchase claim had been received was $6.1 billion,
excluding loans that had been paid in full and file requests for
loans included in the trusts settled with Assured Guaranty. There
will likely be additional requests for loan files in the future leading
to repurchase claims.
We have had limited experience with the monoline insurers,
other than Assured Guaranty, in the repurchase process as each
of these monoline insurers has instituted litigation against legacy
Countrywide and/or Bank of America, which limits our ability to
enter into constructive dialogue with these monolines to resolve
the open claims. It is not possible at this time to reasonably
estimate probable future repurchase obligations with respect to
those monolines with whom we have limited repurchase
experience and, therefore, no representations and warranties
liability has been recorded in connection with these monolines,
other than a liability for repurchase claims where we have
determined that there are valid loan defects. Our estimated range