Bank of America 2011 Annual Report Download - page 142
Download and view the complete annual report
Please find page 142 of the 2011 Bank of America annual report below. You can navigate through the pages in the report by either clicking on the pages listed below, or by using the keyword search tool below to find specific information within the annual report.-
 1
1 -
2
-
3
-
4
-
5
-
6
-
7
-
8
-
9
-
10
-
11
-
12
-
13
-
14
-
15
-
16
-
17
-
18
-
19
-
20
-
21
-
22
-
23
-
24
-
25
-
26
-
27
-
28
-
29
-
30
-
31
-
32
-
33
-
34
-
35
-
36
-
37
-
38
-
39
-
40
-
41
-
42
-
43
-
44
-
45
-
46
-
47
-
48
-
49
-
50
-
51
-
52
-
53
-
54
-
55
-
56
-
57
-
58
-
59
-
60
-
61
-
62
-
63
-
64
-
65
-
66
-
67
-
68
-
69
-
70
-
71
-
72
-
73
-
74
-
75
-
76
-
77
-
78
-
79
-
80
-
81
-
82
-
83
-
84
-
85
-
86
-
87
-
88
-
89
-
90
-
91
-
92
-
93
-
94
-
95
-
96
-
97
-
98
-
99
-
100
-
101
-
102
-
103
-
104
-
105
-
106
-
107
-
108
-
109
-
110
-
111
-
112
-
113
-
114
-
115
-
116
-
117
-
118
-
119
-
120
-
121
-
122
-
123
-
124
-
125
-
126
-
127
-
128
-
129
-
130
-
131
-
 132
132 -
 133
133 -
 134
134 -
 135
135 -
 136
136 -
 137
137 -
 138
138 -
 139
139 -
 140
140 -
 141
141 -
 142
142 -
 143
143 -
 144
144 -
 145
145 -
 146
146 -
 147
147 -
 148
148 -
 149
149 -
 150
150 -
 151
151 -
 152
152 -
153
-
154
-
155
-
156
-
157
-
158
-
159
-
160
-
161
-
162
-
163
-
164
-
165
-
166
-
167
-
168
-
169
-
170
-
171
-
172
-
173
-
174
-
175
-
176
-
177
-
178
-
179
-
180
-
181
-
182
-
183
-
184
-
185
-
186
-
187
-
188
-
189
-
190
-
191
-
192
-
193
-
194
-
195
-
196
-
197
-
198
-
199
-
200
-
201
-
202
-
203
-
204
-
205
-
206
-
207
-
208
-
209
-
210
-
211
-
212
-
213
-
214
-
215
-
216
-
217
-
218
-
219
-
220
-
221
-
222
-
223
-
224
-
225
-
226
-
227
-
228
-
229
-
230
-
231
-
232
-
233
-
234
-
235
-
236
-
237
-
238
-
239
-
240
-
241
-
242
-
243
-
244
-
245
-
246
-
247
-
248
-
249
-
250
-
251
-
252
-
253
-
254
-
255
-
256
-
257
-
258
-
259
-
260
-
261
-
262
-
263
-
264
-
265
-
266
-
267
-
268
-
269
-
270
-
271
-
272
-
273
-
274
-
275
-
276
 |
 |

140 Bank of America 2011
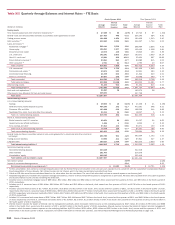
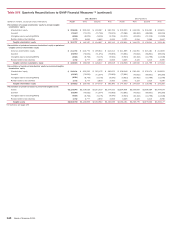
Table XVII Quarterly Reconciliations to GAAP Financial Measures (1) (continued)
(Dollars in millions, except per share information)
Reconciliation of average shareholders’ equity to average tangible
shareholders’ equity
Shareholders’ equity
Goodwill
Intangible assets (excluding MSRs)
Related deferred tax liabilities
Tangible shareholders’ equity
Reconciliation of period-end common shareholders’ equity to period-end
tangible common shareholders’ equity
Common shareholders’ equity
Goodwill
Intangible assets (excluding MSRs)
Related deferred tax liabilities
Tangible common shareholders’ equity
Reconciliation of period-end shareholders’ equity to period-end tangible
shareholders’ equity
Shareholders’ equity
Goodwill
Intangible assets (excluding MSRs)
Related deferred tax liabilities
Tangible shareholders’ equity
Reconciliation of period-end assets to period-end tangible assets
Assets
Goodwill
Intangible assets (excluding MSRs)
Related deferred tax liabilities
Tangible assets
2011 Quarters
Fourth
$ 228,235
(70,647)
(8,566)
2,775
$ 151,797
$ 211,704
(69,967)
(8,021)
2,702
$ 136,418
$ 230,101
(69,967)
(8,021)
2,702
$ 154,815
$ 2,129,046
(69,967)
(8,021)
2,702
$ 2,053,760
Third
$ 222,410
(71,070)
(9,005)
2,852
$ 145,187
$ 210,772
(70,832)
(8,764)
2,777
$ 133,953
$ 230,252
(70,832)
(8,764)
2,777
$ 153,433
$2,219,628
(70,832)
(8,764)
2,777
$2,142,809
Second
$ 235,067
(73,748)
(9,394)
2,932
$ 154,857
$ 205,614
(71,074)
(9,176)
2,853
$ 128,217
$ 222,176
(71,074)
(9,176)
2,853
$ 144,779
$2,261,319
(71,074)
(9,176)
2,853
$2,183,922
First
$ 230,769
(73,922)
(9,769)
3,035
$150,113
$ 214,314
(73,869)
(9,560)
2,933
$ 133,818
$ 230,876
(73,869)
(9,560)
2,933
$ 150,380
$2,274,532
(73,869)
(9,560)
2,933
$2,194,036
2010 Quarters
Fourth
$ 235,525
(75,584)
(10,211)
3,121
$ 152,851
$ 211,686
(73,861)
(9,923)
3,036
$ 130,938
$ 228,248
(73,861)
(9,923)
3,036
$ 147,500
$2,264,909
(73,861)
(9,923)
3,036
$2,184,161
Third
$ 233,978
(82,484)
(10,629)
3,214
$ 144,079
$ 212,391
(75,602)
(10,402)
3,123
$ 129,510
$ 230,495
(75,602)
(10,402)
3,123
$ 147,614
$2,339,660
(75,602)
(10,402)
3,123
$2,256,779
Second
$ 233,461
(86,099)
(11,216)
3,395
$ 139,541
$ 215,181
(85,801)
(10,796)
3,215
$ 121,799
$ 233,174
(85,801)
(10,796)
3,215
$ 139,792
$2,368,384
(85,801)
(10,796)
3,215
$2,275,002
First
$229,891
(86,334)
(11,906)
3,497
$135,148
$211,859
(86,305)
(11,548)
3,396
$117,402
$229,823
(86,305)
(11,548)
3,396
$135,366
$2,344,634
(86,305)
(11,548)
3,396
$2,250,177
For footnotes see page 139.