Bank of America 2011 Annual Report Download - page 126
Download and view the complete annual report
Please find page 126 of the 2011 Bank of America annual report below. You can navigate through the pages in the report by either clicking on the pages listed below, or by using the keyword search tool below to find specific information within the annual report.-
 1
1 -
2
-
3
-
4
-
5
-
6
-
7
-
8
-
9
-
10
-
11
-
12
-
13
-
14
-
15
-
16
-
17
-
18
-
19
-
20
-
21
-
22
-
23
-
24
-
25
-
26
-
27
-
28
-
29
-
30
-
31
-
32
-
33
-
34
-
35
-
36
-
37
-
38
-
39
-
40
-
41
-
42
-
43
-
44
-
45
-
46
-
47
-
48
-
49
-
50
-
51
-
52
-
53
-
54
-
55
-
56
-
57
-
58
-
59
-
60
-
61
-
62
-
63
-
64
-
65
-
66
-
67
-
68
-
69
-
70
-
71
-
72
-
73
-
74
-
75
-
76
-
77
-
78
-
79
-
80
-
81
-
82
-
83
-
84
-
85
-
86
-
87
-
88
-
89
-
90
-
91
-
92
-
93
-
94
-
95
-
96
-
97
-
98
-
99
-
100
-
101
-
102
-
103
-
104
-
105
-
106
-
107
-
108
-
109
-
110
-
111
-
112
-
113
-
114
-
115
-
 116
116 -
 117
117 -
 118
118 -
 119
119 -
 120
120 -
 121
121 -
 122
122 -
 123
123 -
 124
124 -
 125
125 -
 126
126 -
 127
127 -
 128
128 -
 129
129 -
 130
130 -
 131
131 -
 132
132 -
 133
133 -
 134
134 -
 135
135 -
 136
136 -
137
-
138
-
139
-
140
-
141
-
142
-
143
-
144
-
145
-
146
-
147
-
148
-
149
-
150
-
151
-
152
-
153
-
154
-
155
-
156
-
157
-
158
-
159
-
160
-
161
-
162
-
163
-
164
-
165
-
166
-
167
-
168
-
169
-
170
-
171
-
172
-
173
-
174
-
175
-
176
-
177
-
178
-
179
-
180
-
181
-
182
-
183
-
184
-
185
-
186
-
187
-
188
-
189
-
190
-
191
-
192
-
193
-
194
-
195
-
196
-
197
-
198
-
199
-
200
-
201
-
202
-
203
-
204
-
205
-
206
-
207
-
208
-
209
-
210
-
211
-
212
-
213
-
214
-
215
-
216
-
217
-
218
-
219
-
220
-
221
-
222
-
223
-
224
-
225
-
226
-
227
-
228
-
229
-
230
-
231
-
232
-
233
-
234
-
235
-
236
-
237
-
238
-
239
-
240
-
241
-
242
-
243
-
244
-
245
-
246
-
247
-
248
-
249
-
250
-
251
-
252
-
253
-
254
-
255
-
256
-
257
-
258
-
259
-
260
-
261
-
262
-
263
-
264
-
265
-
266
-
267
-
268
-
269
-
270
-
271
-
272
-
273
-
274
-
275
-
276
 |
 |

124 Bank of America 2011
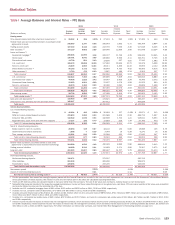
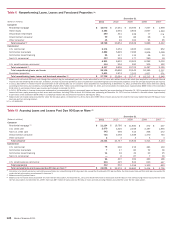
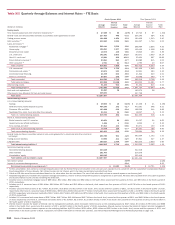
Table II Analysis of Changes in Net Interest Income – FTE Basis
(Dollars in millions)
Increase (decrease) in interest income
Time deposits placed and other short-term investments (2)
Federal funds sold and securities borrowed or purchased under agreements to resell
Trading account assets
Debt securities
Loans and leases:
Residential mortgage
Home equity
Discontinued real estate
U.S. credit card
Non-U.S. credit card
Direct/Indirect consumer
Other consumer
Total consumer
U.S. commercial
Commercial real estate
Commercial lease financing
Non-U.S. commercial
Total commercial
Total loans and leases
Other earning assets
Total interest income
Increase (decrease) in interest expense
U.S. interest-bearing deposits:
Savings
NOW and money market deposit accounts
Consumer CDs and IRAs
Negotiable CDs, public funds and other time deposits
Total U.S. interest-bearing deposits
Non-U.S. interest-bearing deposits:
Banks located in non-U.S. countries
Governments and official institutions
Time, savings and other
Total non-U.S. interest-bearing deposits
Total interest-bearing deposits
Federal funds purchased, securities loaned or sold under agreements to repurchase and
other short-term borrowings
Trading account liabilities
Long-term debt
Total interest expense
Net increase (decrease) in interest income (2)
From 2010 to 2011
Due to Change in (1)
Volume
$7
(92)
(868)
489
957
(615)
34
(1,337)
(487)
(317)
(11)
(131)
(517)
(3)
584
(619)
$17
101
(381)
(5)
21
(4)
39
(910)
(200)
(1,955)
Rate
$67
407
(40)
(2,737)
(1,597)
(334)
(60)
(499)
(307)
(720)
1
(418)
39
(66)
(293)
206
$ (74)
(446)
(297)
(101)
(27)
1
161
1,810
(159)
55
Net
Change
$74
315
(908)
(2,248)
(640)
(949)
(26)
(1,836)
(794)
(1,037)
(10)
(5,292)
(549)
(478)
(69)
291
(805)
(6,097)
(413)
$(9,277)
$(57)
(345)
(678)
(106)
(1,186)
(6)
(3)
200
191
(995)
900
(359)
(1,900)
(2,354)
$(6,923)
From 2009 to 2010
Due to Change in (1)
Volume
$1
266
(135)
2,585
(192)
(391)
(219)
7,097
903
(198)
(27)
(1,106)
(436)
(24)
(121)
(511)
$20
342
(1,745)
(252)
(4)
(7)
(11)
(649)
556
1,509
Rate
$ (43)
(1,328)
(1,051)
(3,959)
(1,607)
(355)
(336)
(119)
425
(1,065)
(24)
132
64
104
(194)
(675)
$ (78)
(494)
(1,586)
5
3
1
(4)
(1,164)
(60)
(3,215)
Net
Change
$ (42)
(1,062)
(1,186)
(1,374)
(1,799)
(746)
(555)
6,978
1,328
(1,263)
(51)
3,892
(974)
(372)
80
(315)
(1,581)
2,311
(1,186)
$ (2,539)
$ (58)
(152)
(3,331)
(247)
(3,788)
(1)
(6)
(15)
(22)
(3,810)
(1,813)
496
(1,706)
(6,833)
$ 4,294
(1) The changes for each category of interest income and expense are divided between the portion of change attributable to the variance in volume and the portion of change attributable to the variance
in rate for that category. The unallocated change in rate or volume variance is allocated between the rate and volume variances.
(2) For this presentation, fees earned on overnight deposits placed with the Federal Reserve are included in the cash and cash equivalents line, consistent with the Corporation's Consolidated Balance
Sheet presentation of these deposits. Net interest income in the table is calculated excluding these fees.