Bank of America 2011 Annual Report Download - page 242
Download and view the complete annual report
Please find page 242 of the 2011 Bank of America annual report below. You can navigate through the pages in the report by either clicking on the pages listed below, or by using the keyword search tool below to find specific information within the annual report.-
 1
1 -
2
-
3
-
4
-
5
-
6
-
7
-
8
-
9
-
10
-
11
-
12
-
13
-
14
-
15
-
16
-
17
-
18
-
19
-
20
-
21
-
22
-
23
-
24
-
25
-
26
-
27
-
28
-
29
-
30
-
31
-
32
-
33
-
34
-
35
-
36
-
37
-
38
-
39
-
40
-
41
-
42
-
43
-
44
-
45
-
46
-
47
-
48
-
49
-
50
-
51
-
52
-
53
-
54
-
55
-
56
-
57
-
58
-
59
-
60
-
61
-
62
-
63
-
64
-
65
-
66
-
67
-
68
-
69
-
70
-
71
-
72
-
73
-
74
-
75
-
76
-
77
-
78
-
79
-
80
-
81
-
82
-
83
-
84
-
85
-
86
-
87
-
88
-
89
-
90
-
91
-
92
-
93
-
94
-
95
-
96
-
97
-
98
-
99
-
100
-
101
-
102
-
103
-
104
-
105
-
106
-
107
-
108
-
109
-
110
-
111
-
112
-
113
-
114
-
115
-
116
-
117
-
118
-
119
-
120
-
121
-
122
-
123
-
124
-
125
-
126
-
127
-
128
-
129
-
130
-
131
-
132
-
133
-
134
-
135
-
136
-
137
-
138
-
139
-
140
-
141
-
142
-
143
-
144
-
145
-
146
-
147
-
148
-
149
-
150
-
151
-
152
-
153
-
154
-
155
-
156
-
157
-
158
-
159
-
160
-
161
-
162
-
163
-
164
-
165
-
166
-
167
-
168
-
169
-
170
-
171
-
172
-
173
-
174
-
175
-
176
-
177
-
178
-
179
-
180
-
181
-
182
-
183
-
184
-
185
-
186
-
187
-
188
-
189
-
190
-
191
-
192
-
193
-
194
-
195
-
196
-
197
-
198
-
199
-
200
-
201
-
202
-
203
-
204
-
205
-
206
-
207
-
208
-
209
-
210
-
211
-
212
-
213
-
214
-
215
-
216
-
217
-
218
-
219
-
220
-
221
-
222
-
223
-
224
-
225
-
226
-
227
-
228
-
229
-
230
-
231
-
 232
232 -
 233
233 -
 234
234 -
 235
235 -
 236
236 -
 237
237 -
 238
238 -
 239
239 -
 240
240 -
 241
241 -
 242
242 -
 243
243 -
 244
244 -
 245
245 -
 246
246 -
 247
247 -
 248
248 -
 249
249 -
 250
250 -
 251
251 -
 252
252 -
253
-
254
-
255
-
256
-
257
-
258
-
259
-
260
-
261
-
262
-
263
-
264
-
265
-
266
-
267
-
268
-
269
-
270
-
271
-
272
-
273
-
274
-
275
-
276
 |
 |

240 Bank of America 2011
The Expected Return on Asset assumption (EROA assumption)
was developed through analysis of historical market returns,
historical asset class volatility and correlations, current market
conditions, anticipated future asset allocations, the funds’ past
experience, and expectations on potential future market returns.
The EROA assumption is determined using the calculated market-
related value for the Qualified Pension Plans and the Other Pension
Plan and the fair value for the Non-U.S. Pension Plans and
Postretirement Health and Life Plans. The EROA assumption
represents a long-term average view of the performance of the
assets in the Qualified Pension Plans, the Non-U.S. Pension Plans,
the Other Pension Plan, and Postretirement Health and Life Plans,
a return that may or may not be achieved during any one calendar
year. Some of the building blocks used to arrive at the long-term
return assumption include an implied return from equity securities
of 8.75 percent, debt securities of 5.75 percent and real estate
of 7.00 percent for the Qualified Pension Plans, the Non-U.S.
Pension Plans, the Other Pension Plan, and Postretirement Health
and Life Plans. The terminated U.S. pension plan is solely invested
in a group annuity contract which is primarily invested in fixed-
income securities structured such that asset maturities match the
duration of the plan’s obligations.
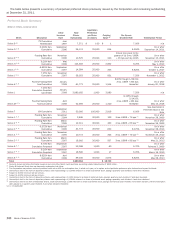
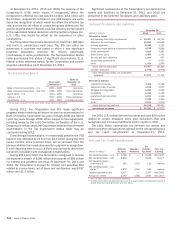
The target allocations for 2012 by asset category for the
Qualified Pension Plans, Non-U.S. Pension Plans, Nonqualified and
Other Pension Plans, and Postretirement Health and Life Plans are
presented in the table below.
2012 Target Allocation Percentage
Asset Category
Equity securities
Debt securities
Real estate
Other
Qualified
Pension Plans
60 – 80
20 – 40
0 – 5
0 – 10
Non-U.S.
Pension Plans
25 – 75
10 – 60
0 – 15
5 – 40
Nonqualified
and Other
Pension Plans
0 – 5
95 – 100
0 – 5
0 – 5
Postretirement
Health and Life
Plans
50 – 75
25 – 45
0 – 5
0 – 5
Equity securities for the Qualified Pension Plans include
common stock of the Corporation in the amounts of $82 million
(0.55 percent of total plan assets) and $189 million (1.21 percent
of total plan assets) at December 31, 2011 and 2010.
Fair Value Measurements
For information on fair value measurements, including descriptions
of Level 1, 2 and 3 of the fair value hierarchy and the valuation
methods employed by the Corporation, see Note 1 – Summary of
Significant Accounting Principles and Note 22 – Fair Value
Measurements.