Bank of America 2011 Annual Report Download - page 107
Download and view the complete annual report
Please find page 107 of the 2011 Bank of America annual report below. You can navigate through the pages in the report by either clicking on the pages listed below, or by using the keyword search tool below to find specific information within the annual report.-
 1
1 -
2
-
3
-
4
-
5
-
6
-
7
-
8
-
9
-
10
-
11
-
12
-
13
-
14
-
15
-
16
-
17
-
18
-
19
-
20
-
21
-
22
-
23
-
24
-
25
-
26
-
27
-
28
-
29
-
30
-
31
-
32
-
33
-
34
-
35
-
36
-
37
-
38
-
39
-
40
-
41
-
42
-
43
-
44
-
45
-
46
-
47
-
48
-
49
-
50
-
51
-
52
-
53
-
54
-
55
-
56
-
57
-
58
-
59
-
60
-
61
-
62
-
63
-
64
-
65
-
66
-
67
-
68
-
69
-
70
-
71
-
72
-
73
-
74
-
75
-
76
-
77
-
78
-
79
-
80
-
81
-
82
-
83
-
84
-
85
-
86
-
87
-
88
-
89
-
90
-
91
-
92
-
93
-
94
-
95
-
96
-
 97
97 -
 98
98 -
 99
99 -
 100
100 -
 101
101 -
 102
102 -
 103
103 -
 104
104 -
 105
105 -
 106
106 -
 107
107 -
 108
108 -
 109
109 -
 110
110 -
 111
111 -
 112
112 -
 113
113 -
 114
114 -
 115
115 -
 116
116 -
 117
117 -
118
-
119
-
120
-
121
-
122
-
123
-
124
-
125
-
126
-
127
-
128
-
129
-
130
-
131
-
132
-
133
-
134
-
135
-
136
-
137
-
138
-
139
-
140
-
141
-
142
-
143
-
144
-
145
-
146
-
147
-
148
-
149
-
150
-
151
-
152
-
153
-
154
-
155
-
156
-
157
-
158
-
159
-
160
-
161
-
162
-
163
-
164
-
165
-
166
-
167
-
168
-
169
-
170
-
171
-
172
-
173
-
174
-
175
-
176
-
177
-
178
-
179
-
180
-
181
-
182
-
183
-
184
-
185
-
186
-
187
-
188
-
189
-
190
-
191
-
192
-
193
-
194
-
195
-
196
-
197
-
198
-
199
-
200
-
201
-
202
-
203
-
204
-
205
-
206
-
207
-
208
-
209
-
210
-
211
-
212
-
213
-
214
-
215
-
216
-
217
-
218
-
219
-
220
-
221
-
222
-
223
-
224
-
225
-
226
-
227
-
228
-
229
-
230
-
231
-
232
-
233
-
234
-
235
-
236
-
237
-
238
-
239
-
240
-
241
-
242
-
243
-
244
-
245
-
246
-
247
-
248
-
249
-
250
-
251
-
252
-
253
-
254
-
255
-
256
-
257
-
258
-
259
-
260
-
261
-
262
-
263
-
264
-
265
-
266
-
267
-
268
-
269
-
270
-
271
-
272
-
273
-
274
-
275
-
276
 |
 |

Bank of America 2011 105
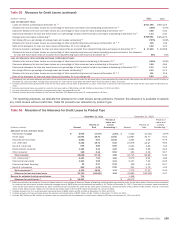
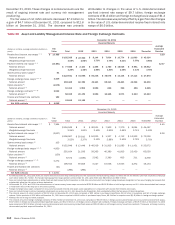
Table 55
(Dollars in millions)
Loan and allowance ratios:
Loans and leases outstanding at December 31 (5)
Allowance for loan and lease losses as a percentage of total loans and leases and outstanding at December 31 (5)
Consumer allowance for loan and lease losses as a percentage of total consumer loans outstanding at December 31 (6)
Commercial allowance for loan and lease losses as a percentage of total commercial loans and leases outstanding at December 31 (7)
Average loans and leases outstanding (5)
Net charge-offs as a percentage of average loans and leases outstanding (5)
Allowance for loan and lease losses as a percentage of total nonperforming loans and leases at December 31 (5, 8)
Ratio of the allowance for loan and lease losses at December 31 to net charge-offs
Amounts included in allowance for loan and lease losses that are excluded from nonperforming loans and leases at December 31 (9)
Allowance for loan and lease losses as a percentage of total nonperforming loans and leases excluding amounts included in the allowance
for loan and lease losses that are excluded from nonperforming loans and leases at December 31 (9)
Loan and allowance ratios excluding purchased credit-impaired loans:
Allowance for loan and lease losses as a percentage of total loans and leases outstanding at December 31 (5)
Consumer allowance for loan and lease losses as a percentage of total consumer loans outstanding at December 31 (6)
Commercial allowance for loan and lease losses as a percentage of total commercial loans and leases outstanding at December 31 (7)
Net charge-offs as a percentage of average loans and leases outstanding (5)
Allowance for loan and lease losses as a percentage of total nonperforming loans and leases at December 31 (5, 8)
Ratio of the allowance for loan and lease losses at December 31 to net charge-offs
Allowance for Credit Losses (continued)
2011
$ 917,396
3.68%
4.88
1.33
$ 929,661
2.24%
135
1.62
$17,490
65%
2.86%
3.68
1.33
2.32
101
1.22
2010
$937,119
4.47%
5.40
2.44
$954,278
3.60%
136
1.22
$ 22,908
62%
3.94%
4.66
2.44
3.73
116
1.04
(5) Outstanding loan and lease balances and ratios do not include loans accounted for under the fair value option. Loans accounted for under the fair value option were $8.8 billion and $3.3 billion at
December 31, 2011 and 2010. Average loans accounted for under the fair value option were $8.4 billion and $4.1 billion in 2011 and 2010.
(6) Excludes consumer loans accounted for under the fair value option of $2.2 billion at December 31, 2011. There were no consumer loans accounted for under the fair value option at December 31,
2010.
(7) Excludes commercial loans accounted for under the fair value option of $6.6 billion and $3.3 billion at December 31, 2011 and 2010.
(8) For more information on our definition of nonperforming loans, see pages 86 and 94.
(9) Primarily includes amounts allocated to Card Services portfolios, PCI loans and the non-U.S. credit portfolio in All Other.
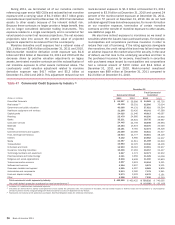
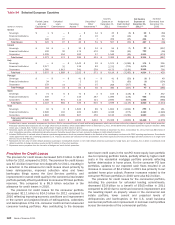
For reporting purposes, we allocate the allowance for credit losses across products. However, the allowance is available to absorb
any credit losses without restriction. Table 56 presents our allocation by product type.
Table 56
(Dollars in millions)
Allowance for loan and lease losses
Residential mortgage
Home equity
Discontinued real estate
U.S. credit card
Non-U.S. credit card
Direct/Indirect consumer
Other consumer
Total consumer
U.S. commercial (2)
Commercial real estate
Commercial lease financing
Non-U.S. commercial
Total commercial (3)
Allowance for loan and lease losses
Reserve for unfunded lending commitments
Allowance for credit losses (4)
Allocation of the Allowance for Credit Losses by Product Type
December 31, 2011
Amount
$ 5,935
13,094
2,050
6,322
946
1,153
148
29,648
2,441
1,349
92
253
4,135
33,783
714
$ 34,497
Percent of
Total
17.57%
38.76
6.07
18.71
2.80
3.41
0.44
87.76
7.23
3.99
0.27
0.75
12.24
100.00%
Percent of
Loans and
Leases
Outstanding (1)
2.26%
10.50
18.48
6.18
6.56
1.29
5.50
4.88
1.26
3.41
0.42
0.46
1.33
3.68
December 31, 2010
Amount
$ 5,082
12,887
1,283
10,876
2,045
2,381
161
34,715
3,576
3,137
126
331
7,170
41,885
1,188
$ 43,073
Percent of
Total
12.14%
30.77
3.06
25.97
4.88
5.68
0.38
82.88
8.54
7.49
0.30
0.79
17.12
100.00%
Percent of
Loans and
Leases
Outstanding (1)
1.97%
9.34
9.79
9.56
7.45
2.64
5.67
5.40
1.88
6.35
0.57
1.03
2.44
4.47
(1) Ratios are calculated as allowance for loan and lease losses as a percentage of loans and leases outstanding excluding loans accounted for under the fair value option. Consumer loans accounted
for under the fair value option included residential mortgage loans of $906 million and discontinued real estate of $1.3 billion at December 31, 2011. There were no consumer loans accounted for
under the fair value option at December 31, 2010. Commercial loans accounted for under the fair value option included U.S. commercial loans of $2.2 billion and $1.6 billion, non-U.S. commercial
loans of $4.4 billion and $1.7 billion and commercial real estate loans of $0 and $79 million at December 31, 2011 and 2010.
(2) Includes allowance for U.S. small business commercial loans of $893 million and $1.5 billion at December 31, 2011 and 2010.
(3) Includes allowance for loan and lease losses for impaired commercial loans of $545 million and $1.1 billion at December 31, 2011 and 2010.
(4) Includes $8.5 billion and $6.4 billion of valuation reserves presented with the allowance for credit losses related to PCI loans at December 31, 2011 and 2010.