Bank of America 2011 Annual Report Download - page 144
Download and view the complete annual report
Please find page 144 of the 2011 Bank of America annual report below. You can navigate through the pages in the report by either clicking on the pages listed below, or by using the keyword search tool below to find specific information within the annual report.-
 1
1 -
2
-
3
-
4
-
5
-
6
-
7
-
8
-
9
-
10
-
11
-
12
-
13
-
14
-
15
-
16
-
17
-
18
-
19
-
20
-
21
-
22
-
23
-
24
-
25
-
26
-
27
-
28
-
29
-
30
-
31
-
32
-
33
-
34
-
35
-
36
-
37
-
38
-
39
-
40
-
41
-
42
-
43
-
44
-
45
-
46
-
47
-
48
-
49
-
50
-
51
-
52
-
53
-
54
-
55
-
56
-
57
-
58
-
59
-
60
-
61
-
62
-
63
-
64
-
65
-
66
-
67
-
68
-
69
-
70
-
71
-
72
-
73
-
74
-
75
-
76
-
77
-
78
-
79
-
80
-
81
-
82
-
83
-
84
-
85
-
86
-
87
-
88
-
89
-
90
-
91
-
92
-
93
-
94
-
95
-
96
-
97
-
98
-
99
-
100
-
101
-
102
-
103
-
104
-
105
-
106
-
107
-
108
-
109
-
110
-
111
-
112
-
113
-
114
-
115
-
116
-
117
-
118
-
119
-
120
-
121
-
122
-
123
-
124
-
125
-
126
-
127
-
128
-
129
-
130
-
131
-
132
-
133
-
 134
134 -
 135
135 -
 136
136 -
 137
137 -
 138
138 -
 139
139 -
 140
140 -
 141
141 -
 142
142 -
 143
143 -
 144
144 -
 145
145 -
 146
146 -
 147
147 -
 148
148 -
 149
149 -
 150
150 -
 151
151 -
 152
152 -
 153
153 -
 154
154 -
155
-
156
-
157
-
158
-
159
-
160
-
161
-
162
-
163
-
164
-
165
-
166
-
167
-
168
-
169
-
170
-
171
-
172
-
173
-
174
-
175
-
176
-
177
-
178
-
179
-
180
-
181
-
182
-
183
-
184
-
185
-
186
-
187
-
188
-
189
-
190
-
191
-
192
-
193
-
194
-
195
-
196
-
197
-
198
-
199
-
200
-
201
-
202
-
203
-
204
-
205
-
206
-
207
-
208
-
209
-
210
-
211
-
212
-
213
-
214
-
215
-
216
-
217
-
218
-
219
-
220
-
221
-
222
-
223
-
224
-
225
-
226
-
227
-
228
-
229
-
230
-
231
-
232
-
233
-
234
-
235
-
236
-
237
-
238
-
239
-
240
-
241
-
242
-
243
-
244
-
245
-
246
-
247
-
248
-
249
-
250
-
251
-
252
-
253
-
254
-
255
-
256
-
257
-
258
-
259
-
260
-
261
-
262
-
263
-
264
-
265
-
266
-
267
-
268
-
269
-
270
-
271
-
272
-
273
-
274
-
275
-
276
 |
 |
142 Bank of America 2011
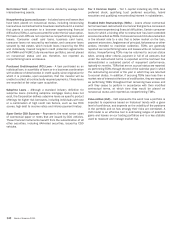
Net Interest Yield – Net interest income divided by average total
interest-earning assets.
Nonperforming Loans and Leases – Includes loans and leases that
have been placed on nonaccrual status, including nonaccruing
loans whose contractual terms have been restructured in a manner
that grants a concession to a borrower experiencing financial
difficulties (TDRs). Loans accounted for under the fair value option,
PCI loans and LHFS are not reported as nonperforming loans and
leases. Consumer credit card loans, business card loans,
consumer loans not secured by real estate, and consumer loans
secured by real estate, which include loans insured by the FHA
and individually insured long-term credit protection agreements
with FNMA and FHLMC (fully-insured loan portfolio), are not placed
on nonaccrual status and are, therefore, not reported as
nonperforming loans and leases.
Purchased Credit-impaired (PCI) Loan – A loan purchased as an
individual loan, in a portfolio of loans or in a business combination
with evidence of deterioration in credit quality since origination for
which it is probable, upon acquisition, that the investor will be
unable to collect all contractually required payments. These loans
are recorded at fair value upon acquisition.
Subprime Loans – Although a standard industry definition for
subprime loans (including subprime mortgage loans) does not
exist, the Corporation defines subprime loans as specific product
offerings for higher risk borrowers, including individuals with one
or a combination of high credit risk factors, such as low FICO
scores, high debt to income ratios and inferior payment history.
Super Senior CDO Exposure – Represents the most senior class
of commercial paper or notes that are issued by CDO vehicles.
These financial instruments benefit from the subordination of all
other securities, including AAA-rated securities, issued by CDO
vehicles.
Tier 1 Common Capital – Tier 1 capital including any CES, less
preferred stock, qualifying trust preferred securities, hybrid
securities and qualifying noncontrolling interest in subsidiaries.
Troubled Debt Restructurings (TDRs) – Loans whose contractual
terms have been restructured in a manner that grants a concession
to a borrower experiencing financial difficulties. Certain consumer
loans for which a binding offer to restructure has been extended
are also classified as TDRs. Concessions could include a reduction
in the interest rate to a rate that is below market on the loan,
payment extensions, forgiveness of principal, forbearance or other
actions intended to maximize collection. TDRs are generally
reported as nonperforming loans and leases while on nonaccrual
status. Nonperforming TDRs may be returned to accrual status
when, among other criteria, payment in full of all amounts due
under the restructured terms is expected and the borrower has
demonstrated a sustained period of repayment performance,
typically six months. TDRs that are on accrual status are reported
as performing TDRs through the end of the calendar year in which
the restructuring occurred or the year in which they are returned
to accrual status. In addition, if accruing TDRs bear less than a
market rate of interest at the time of modification, they are reported
as performing TDRs throughout their remaining lives unless and
until they cease to perform in accordance with their modified
contractual terms, at which time they would be placed on
nonaccrual status and reported as nonperforming TDRs.
Value-at-Risk (VaR) – VaR represents the worst loss a portfolio is
expected to experience based on historical trends with a given
level of confidence, and depends on the volatility of the positions
in the portfolio and on how strongly their risks are correlated. A
VaR model is an effective tool in estimating ranges of potential
gains and losses on our trading portfolios and is a key statistic
used to measure and manage market risk.