Bank of America 2011 Annual Report Download - page 49
Download and view the complete annual report
Please find page 49 of the 2011 Bank of America annual report below. You can navigate through the pages in the report by either clicking on the pages listed below, or by using the keyword search tool below to find specific information within the annual report.-
 1
1 -
2
-
3
-
4
-
5
-
6
-
7
-
8
-
9
-
10
-
11
-
12
-
13
-
14
-
15
-
16
-
17
-
18
-
19
-
20
-
21
-
22
-
23
-
24
-
25
-
26
-
27
-
28
-
29
-
30
-
31
-
32
-
33
-
34
-
35
-
36
-
37
-
38
-
 39
39 -
 40
40 -
 41
41 -
 42
42 -
 43
43 -
 44
44 -
 45
45 -
 46
46 -
 47
47 -
 48
48 -
 49
49 -
 50
50 -
 51
51 -
 52
52 -
 53
53 -
 54
54 -
 55
55 -
 56
56 -
 57
57 -
 58
58 -
 59
59 -
60
-
61
-
62
-
63
-
64
-
65
-
66
-
67
-
68
-
69
-
70
-
71
-
72
-
73
-
74
-
75
-
76
-
77
-
78
-
79
-
80
-
81
-
82
-
83
-
84
-
85
-
86
-
87
-
88
-
89
-
90
-
91
-
92
-
93
-
94
-
95
-
96
-
97
-
98
-
99
-
100
-
101
-
102
-
103
-
104
-
105
-
106
-
107
-
108
-
109
-
110
-
111
-
112
-
113
-
114
-
115
-
116
-
117
-
118
-
119
-
120
-
121
-
122
-
123
-
124
-
125
-
126
-
127
-
128
-
129
-
130
-
131
-
132
-
133
-
134
-
135
-
136
-
137
-
138
-
139
-
140
-
141
-
142
-
143
-
144
-
145
-
146
-
147
-
148
-
149
-
150
-
151
-
152
-
153
-
154
-
155
-
156
-
157
-
158
-
159
-
160
-
161
-
162
-
163
-
164
-
165
-
166
-
167
-
168
-
169
-
170
-
171
-
172
-
173
-
174
-
175
-
176
-
177
-
178
-
179
-
180
-
181
-
182
-
183
-
184
-
185
-
186
-
187
-
188
-
189
-
190
-
191
-
192
-
193
-
194
-
195
-
196
-
197
-
198
-
199
-
200
-
201
-
202
-
203
-
204
-
205
-
206
-
207
-
208
-
209
-
210
-
211
-
212
-
213
-
214
-
215
-
216
-
217
-
218
-
219
-
220
-
221
-
222
-
223
-
224
-
225
-
226
-
227
-
228
-
229
-
230
-
231
-
232
-
233
-
234
-
235
-
236
-
237
-
238
-
239
-
240
-
241
-
242
-
243
-
244
-
245
-
246
-
247
-
248
-
249
-
250
-
251
-
252
-
253
-
254
-
255
-
256
-
257
-
258
-
259
-
260
-
261
-
262
-
263
-
264
-
265
-
266
-
267
-
268
-
269
-
270
-
271
-
272
-
273
-
274
-
275
-
276
 |
 |

Bank of America 2011 47
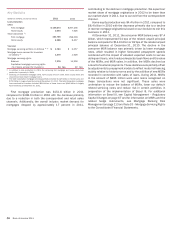
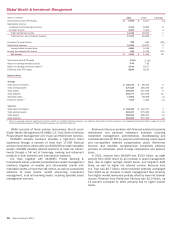
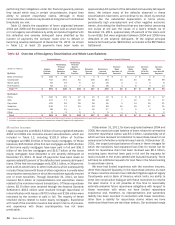
GWIM results are impacted by the migration of clients and their
related deposit and loan balances to or from Deposits, CRES and
the ALM portfolio, as presented in the Migration Summary table.
Migration in 2011 included the movement of balances to Merrill
Edge, which is in Deposits. Subsequent to the date of the migration,
the associated net interest income, noninterest income and
noninterest expense are recorded in the business to which the
clients migrated.
Migration Summary
(Dollars in millions)
Average
Total deposits – GWIM from / (to) Deposits
Total loans – GWIM to CRES and the ALM portfolio
Year end
Total deposits – GWIM from / (to) Deposits
Total loans – GWIM to CRES and the ALM portfolio
2011
$ (2,032)
(174)
$ (2,918)
(299)
2010
$ 2,486
(1,405)
$ 4,317
(1,625)
Net income increased $295 million, or 22 percent, to $1.6
billion in 2011 compared to 2010 driven by higher net interest
income, higher asset management fees and lower credit costs,
partially offset by higher noninterest expense. Net interest income
increased $369 million, or six percent, to $6.0 billion as the impact
of higher average deposit balances more than offset the impact
of a lower rate environment. Noninterest income increased $718
million, or seven percent, to $11.3 billion primarily due to higher
asset management fees driven by higher average market levels in
2011 compared to 2010 and continued long-term AUM flows. The
provision for credit losses decreased $248 million, or 38 percent,
to $398 million driven by improving portfolio trends. Noninterest
expense increased $1.2 billion, or nine percent, to $14.4 billion
due to increased volume-driven expenses and personnel costs
associated with continued investment in the business.
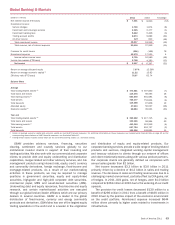
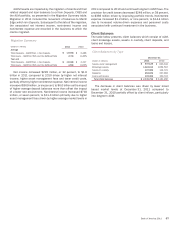
Client Balances
The table below presents client balances which consist of AUM,
client brokerage assets, assets in custody, client deposits, and
loans and leases.
Client Balances by Type
(Dollars in millions)
Assets under management
Brokerage assets
Assets in custody
Deposits
Loans and leases
Total client balances
December 31
2011
$ 647,126
1,024,193
107,989
253,029
103,459
$ 2,135,796
2010
$ 643,343
1,064,516
114,721
257,982
100,724
$ 2,181,286
The decrease in client balances was driven by lower broad
based market levels at December 31, 2011 compared to
December 31, 2010 partially offset by client inflows, particularly
into long-term AUM.