Bank of America 2011 Annual Report Download - page 165
Download and view the complete annual report
Please find page 165 of the 2011 Bank of America annual report below. You can navigate through the pages in the report by either clicking on the pages listed below, or by using the keyword search tool below to find specific information within the annual report.-
 1
1 -
2
-
3
-
4
-
5
-
6
-
7
-
8
-
9
-
10
-
11
-
12
-
13
-
14
-
15
-
16
-
17
-
18
-
19
-
20
-
21
-
22
-
23
-
24
-
25
-
26
-
27
-
28
-
29
-
30
-
31
-
32
-
33
-
34
-
35
-
36
-
37
-
38
-
39
-
40
-
41
-
42
-
43
-
44
-
45
-
46
-
47
-
48
-
49
-
50
-
51
-
52
-
53
-
54
-
55
-
56
-
57
-
58
-
59
-
60
-
61
-
62
-
63
-
64
-
65
-
66
-
67
-
68
-
69
-
70
-
71
-
72
-
73
-
74
-
75
-
76
-
77
-
78
-
79
-
80
-
81
-
82
-
83
-
84
-
85
-
86
-
87
-
88
-
89
-
90
-
91
-
92
-
93
-
94
-
95
-
96
-
97
-
98
-
99
-
100
-
101
-
102
-
103
-
104
-
105
-
106
-
107
-
108
-
109
-
110
-
111
-
112
-
113
-
114
-
115
-
116
-
117
-
118
-
119
-
120
-
121
-
122
-
123
-
124
-
125
-
126
-
127
-
128
-
129
-
130
-
131
-
132
-
133
-
134
-
135
-
136
-
137
-
138
-
139
-
140
-
141
-
142
-
143
-
144
-
145
-
146
-
147
-
148
-
149
-
150
-
151
-
152
-
153
-
154
-
 155
155 -
 156
156 -
 157
157 -
 158
158 -
 159
159 -
 160
160 -
 161
161 -
 162
162 -
 163
163 -
 164
164 -
 165
165 -
 166
166 -
 167
167 -
 168
168 -
 169
169 -
 170
170 -
 171
171 -
 172
172 -
 173
173 -
 174
174 -
 175
175 -
176
-
177
-
178
-
179
-
180
-
181
-
182
-
183
-
184
-
185
-
186
-
187
-
188
-
189
-
190
-
191
-
192
-
193
-
194
-
195
-
196
-
197
-
198
-
199
-
200
-
201
-
202
-
203
-
204
-
205
-
206
-
207
-
208
-
209
-
210
-
211
-
212
-
213
-
214
-
215
-
216
-
217
-
218
-
219
-
220
-
221
-
222
-
223
-
224
-
225
-
226
-
227
-
228
-
229
-
230
-
231
-
232
-
233
-
234
-
235
-
236
-
237
-
238
-
239
-
240
-
241
-
242
-
243
-
244
-
245
-
246
-
247
-
248
-
249
-
250
-
251
-
252
-
253
-
254
-
255
-
256
-
257
-
258
-
259
-
260
-
261
-
262
-
263
-
264
-
265
-
266
-
267
-
268
-
269
-
270
-
271
-
272
-
273
-
274
-
275
-
276
 |
 |

Bank of America 2011 163
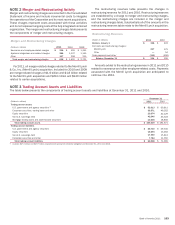
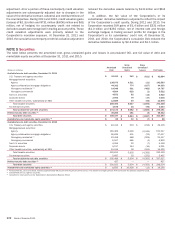
NOTE 2 Merger and Restructuring Activity
Merger and restructuring charges are recorded in the Consolidated
Statement of Income and include incremental costs to integrate
the operations of the Corporation and its most recent acquisitions.
These charges represent costs associated with these activities
and do not represent ongoing costs of the fully integrated combined
organization. The merger and restructuring charges table presents
the components of merger and restructuring charges.
Merger and Restructuring Charges
(Dollars in millions)
Severance and employee-related charges
Systems integrations and related charges
Other
Total merger and restructuring charges
2011
$ 226
285
127
$ 638
2010
$ 455
1,137
228
$ 1,820
2009
$ 1,351
1,155
215
$ 2,721
For 2011, all merger-related charges related to the Merrill Lynch
& Co., Inc. (Merrill Lynch) acquisition. Included for 2010 and 2009
are merger-related charges of $1.6 billion and $1.8 billion related
to the Merrill Lynch acquisition and $202 million and $940 million
related to earlier acquisitions.
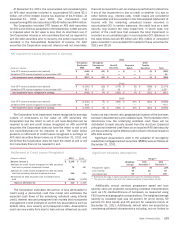
The restructuring reserves table presents the changes in
restructuring reserves for 2011 and 2010. Restructuring reserves
are established by a charge to merger and restructuring charges,
and the restructuring charges are included in the merger and
restructuring charges table. Substantially all of the amounts in the
restructuring reserves table relate to the Merrill Lynch acquisition.
Restructuring Reserves
(Dollars in millions)
Balance, January 1
Exit costs and restructuring charges:
Merrill Lynch
Other
Cash payments and other
Balance, December 31
2011
$ 336
217
—
(319)
$ 234
2010
$ 403
375
54
(496)
$ 336
Amounts added to the restructuring reserves in 2011 and 2010
related to severance and other employee-related costs. Payments
associated with the Merrill Lynch acquisition are anticipated to
continue into 2012.
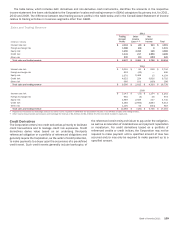
NOTE 3 Trading Account Assets and Liabilities
The table below presents the components of trading account assets and liabilities at December 31, 2011 and 2010.
(Dollars in millions)
Trading account assets
U.S. government and agency securities (1)
Corporate securities, trading loans and other
Equity securities
Non-U.S. sovereign debt
Mortgage trading loans and asset-backed securities
Total trading account assets
Trading account liabilities
U.S. government and agency securities
Equity securities
Non-U.S. sovereign debt
Corporate securities and other
Total trading account liabilities
December 31
2011
$52,613
36,571
23,674
42,946
13,515
$ 169,319
$20,710
14,594
17,440
7,764
$60,508
2010
$ 60,811
49,352
32,129
33,523
18,856
$ 194,671
$ 29,340
15,482
15,813
11,350
$ 71,985
(1) Includes $27.3 billion and $29.7 billion of government-sponsored enterprise obligations at December 31, 2011 and 2010.