Bank of America 2011 Annual Report Download - page 69
Download and view the complete annual report
Please find page 69 of the 2011 Bank of America annual report below. You can navigate through the pages in the report by either clicking on the pages listed below, or by using the keyword search tool below to find specific information within the annual report.-
 1
1 -
2
-
3
-
4
-
5
-
6
-
7
-
8
-
9
-
10
-
11
-
12
-
13
-
14
-
15
-
16
-
17
-
18
-
19
-
20
-
21
-
22
-
23
-
24
-
25
-
26
-
27
-
28
-
29
-
30
-
31
-
32
-
33
-
34
-
35
-
36
-
37
-
38
-
39
-
40
-
41
-
42
-
43
-
44
-
45
-
46
-
47
-
48
-
49
-
50
-
51
-
52
-
53
-
54
-
55
-
56
-
57
-
58
-
 59
59 -
 60
60 -
 61
61 -
 62
62 -
 63
63 -
 64
64 -
 65
65 -
 66
66 -
 67
67 -
 68
68 -
 69
69 -
 70
70 -
 71
71 -
 72
72 -
 73
73 -
 74
74 -
 75
75 -
 76
76 -
 77
77 -
 78
78 -
 79
79 -
80
-
81
-
82
-
83
-
84
-
85
-
86
-
87
-
88
-
89
-
90
-
91
-
92
-
93
-
94
-
95
-
96
-
97
-
98
-
99
-
100
-
101
-
102
-
103
-
104
-
105
-
106
-
107
-
108
-
109
-
110
-
111
-
112
-
113
-
114
-
115
-
116
-
117
-
118
-
119
-
120
-
121
-
122
-
123
-
124
-
125
-
126
-
127
-
128
-
129
-
130
-
131
-
132
-
133
-
134
-
135
-
136
-
137
-
138
-
139
-
140
-
141
-
142
-
143
-
144
-
145
-
146
-
147
-
148
-
149
-
150
-
151
-
152
-
153
-
154
-
155
-
156
-
157
-
158
-
159
-
160
-
161
-
162
-
163
-
164
-
165
-
166
-
167
-
168
-
169
-
170
-
171
-
172
-
173
-
174
-
175
-
176
-
177
-
178
-
179
-
180
-
181
-
182
-
183
-
184
-
185
-
186
-
187
-
188
-
189
-
190
-
191
-
192
-
193
-
194
-
195
-
196
-
197
-
198
-
199
-
200
-
201
-
202
-
203
-
204
-
205
-
206
-
207
-
208
-
209
-
210
-
211
-
212
-
213
-
214
-
215
-
216
-
217
-
218
-
219
-
220
-
221
-
222
-
223
-
224
-
225
-
226
-
227
-
228
-
229
-
230
-
231
-
232
-
233
-
234
-
235
-
236
-
237
-
238
-
239
-
240
-
241
-
242
-
243
-
244
-
245
-
246
-
247
-
248
-
249
-
250
-
251
-
252
-
253
-
254
-
255
-
256
-
257
-
258
-
259
-
260
-
261
-
262
-
263
-
264
-
265
-
266
-
267
-
268
-
269
-
270
-
271
-
272
-
273
-
274
-
275
-
276
 |
 |

Bank of America 2011 67
billion, or approximately 55 bps, while the exchanges increased
Tier 1 common capital $3.9 billion, or approximately 29 bps. The
warrants related to Berkshire, increased Tier 1 common capital
approximately $2.1 billion, or 15 bps. The $8.1 billion increase in
the deferred tax asset disallowance at December 31, 2011
compared to 2010 was primarily due to the expiration of the longer
look-forward period granted by regulators at the time of the Merrill
Lynch acquisition and an increase in net deferred tax assets. Tier
1 capital and Total capital decreased $4.4 billion and $14.5 billion
at December 31, 2011 compared to 2010. For additional
information regarding the sale of our investment in CCB, see Note
5 – Securities to the Consolidated Financial Statements. For
additional information regarding the exchanges and the investment
made by Berkshire, see Note 13 – Long-term Debt and Note 15 –
Shareholders’ Equity to the Consolidated Financial Statements.
Risk-weighted assets decreased $172 billion to $1,284 billion
at December 31, 2011 compared to 2010. The decrease was
driven in part by our sale of CCB shares and our Canadian card
business and is consistent with our continued efforts to reduce
non-core assets and legacy loan portfolios. The Tier 1 common
capital ratio, the Tier 1 capital ratio and the Total capital ratio
increased due to the decline in risk-weighted assets. The Tier 1
leverage ratio increased compared to 2010 reflecting the decrease
in Tier 1 capital and a reduction in adjusted quarterly average total
assets.
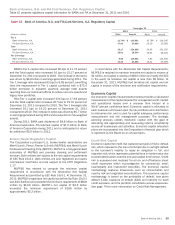
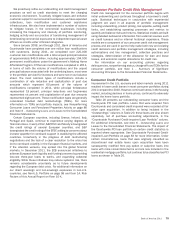
Table 13 presents Bank of America Corporation’s capital ratios
and related information at December 31, 2011 and 2010.
Table 13
(Dollars in billions)
Tier 1 common capital ratio
Tier 1 capital ratio
Total capital ratio
Tier 1 leverage ratio
Risk-weighted assets
Adjusted quarterly average total assets (1)
Bank of America Corporation Regulatory
Capital
December 31
2011
9.86%
12.40
16.75
7.53
$ 1,284
2,114
2010
8.60%
11.24
15.77
7.21
$ 1,456
2,270
(1) Reflects adjusted average total assets for the three months ended December 31, 2011 and
2010.
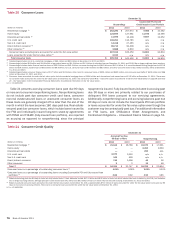
Table 14 presents the capital composition at December 31,
2011 and 2010.
Table 14
(Dollars in millions)
Total common shareholders’ equity
Goodwill
Nonqualifying intangible assets (includes core deposit intangibles, affinity relationships, customer relationships and other intangibles)
Net unrealized gains or losses on AFS debt and marketable equity securities and net losses on derivatives recorded in accumulated
OCI, net-of-tax
Unamortized net periodic benefit costs recorded in accumulated OCI, net-of-tax
Exclusion of fair value adjustment related to structured liabilities (1)
Disallowed deferred tax asset
Other
Total Tier 1 common capital
Qualifying preferred stock
Trust preferred securities
Noncontrolling interest
Total Tier 1 capital
Long-term debt qualifying as Tier 2 capital
Allowance for loan and lease losses
Reserve for unfunded lending commitments
Allowance for loan and lease losses exceeding 1.25 percent of risk-weighted assets
45 percent of the pre-tax net unrealized gains on AFS marketable equity securities
Other
Total capital
Capital Composition
December 31
2011
$ 211,704
(69,967)
(5,848)
682
4,391
944
(16,799)
1,583
126,690
15,479
16,737
326
159,232
38,165
33,783
714
(18,159)
1
1,365
$ 215,101
2010
$ 211,686
(73,861)
(6,846)
(4,137)
3,947
2,984
(8,663)
29
125,139
16,562
21,451
474
163,626
41,270
41,885
1,188
(24,690)
4,777
1,538
$ 229,594
(1) Represents loss on structured liabilities, net-of-tax, that is excluded from Tier 1 common capital, Tier 1 capital and Total capital for regulatory purposes.
Regulatory Capital Changes
We manage regulatory capital to adhere to regulatory standards
of capital adequacy based on our current understanding of the
rules and the application of such rules to our business as currently
conducted. The regulatory capital rules as written by the Basel
Committee on Banking Supervision (Basel Committee) continue
to evolve.
We currently measure and report our capital ratios and related
information in accordance with Basel I. See Capital Management
on page 65 for additional information. Basel I has been subject
to revisions, which include final Basel II rules (Basel II) published
in December 2007 by U.S banking regulators and proposed Basel
III rules (Basel III) published by the Basel Committee in December
2010, and further amended in July 2011. We are currently in the
Basel II parallel period.
On December 29, 2011, U.S. regulators issued a notice of
proposed rulemaking (NPR) that would amend a December 2010
NPR on the Market Risk Rules. This amended NPR is expected to
increase the capital requirements for our trading assets and
liabilities. We continue to evaluate the capital impact of the
proposed rules and currently anticipate that we will be in
compliance with any final rules by the projected implementation
date in late 2012.