Bank of America 2011 Annual Report Download - page 123
Download and view the complete annual report
Please find page 123 of the 2011 Bank of America annual report below. You can navigate through the pages in the report by either clicking on the pages listed below, or by using the keyword search tool below to find specific information within the annual report.-
 1
1 -
2
-
3
-
4
-
5
-
6
-
7
-
8
-
9
-
10
-
11
-
12
-
13
-
14
-
15
-
16
-
17
-
18
-
19
-
20
-
21
-
22
-
23
-
24
-
25
-
26
-
27
-
28
-
29
-
30
-
31
-
32
-
33
-
34
-
35
-
36
-
37
-
38
-
39
-
40
-
41
-
42
-
43
-
44
-
45
-
46
-
47
-
48
-
49
-
50
-
51
-
52
-
53
-
54
-
55
-
56
-
57
-
58
-
59
-
60
-
61
-
62
-
63
-
64
-
65
-
66
-
67
-
68
-
69
-
70
-
71
-
72
-
73
-
74
-
75
-
76
-
77
-
78
-
79
-
80
-
81
-
82
-
83
-
84
-
85
-
86
-
87
-
88
-
89
-
90
-
91
-
92
-
93
-
94
-
95
-
96
-
97
-
98
-
99
-
100
-
101
-
102
-
103
-
104
-
105
-
106
-
107
-
108
-
109
-
110
-
111
-
112
-
 113
113 -
 114
114 -
 115
115 -
 116
116 -
 117
117 -
 118
118 -
 119
119 -
 120
120 -
 121
121 -
 122
122 -
 123
123 -
 124
124 -
 125
125 -
 126
126 -
 127
127 -
 128
128 -
 129
129 -
 130
130 -
 131
131 -
 132
132 -
 133
133 -
134
-
135
-
136
-
137
-
138
-
139
-
140
-
141
-
142
-
143
-
144
-
145
-
146
-
147
-
148
-
149
-
150
-
151
-
152
-
153
-
154
-
155
-
156
-
157
-
158
-
159
-
160
-
161
-
162
-
163
-
164
-
165
-
166
-
167
-
168
-
169
-
170
-
171
-
172
-
173
-
174
-
175
-
176
-
177
-
178
-
179
-
180
-
181
-
182
-
183
-
184
-
185
-
186
-
187
-
188
-
189
-
190
-
191
-
192
-
193
-
194
-
195
-
196
-
197
-
198
-
199
-
200
-
201
-
202
-
203
-
204
-
205
-
206
-
207
-
208
-
209
-
210
-
211
-
212
-
213
-
214
-
215
-
216
-
217
-
218
-
219
-
220
-
221
-
222
-
223
-
224
-
225
-
226
-
227
-
228
-
229
-
230
-
231
-
232
-
233
-
234
-
235
-
236
-
237
-
238
-
239
-
240
-
241
-
242
-
243
-
244
-
245
-
246
-
247
-
248
-
249
-
250
-
251
-
252
-
253
-
254
-
255
-
256
-
257
-
258
-
259
-
260
-
261
-
262
-
263
-
264
-
265
-
266
-
267
-
268
-
269
-
270
-
271
-
272
-
273
-
274
-
275
-
276
 |
 |

Bank of America 2011 121
2010 Compared to 2009
The following discussion and analysis provides a comparison of
our results of operations for 2010 and 2009. This discussion
should be read in conjunction with the Consolidated Financial
Statements and related Notes. Tables 7 and 8 contain financial
data to supplement this discussion.
Overview
Net Income/Loss
Net loss totaled $2.2 billion in 2010 compared to net income of
$6.3 billion in 2009. Including preferred stock dividends, the net
loss applicable to common shareholders was $3.6 billion, or
$(0.37) per diluted share. Those results compared to a net loss
applicable to common shareholders of $2.2 billion, or $(0.29) per
diluted share for 2009.
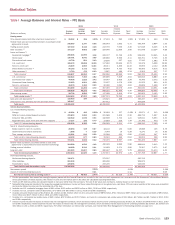
Net Interest Income
Net interest income on a FTE basis increased $4.3 billion to $52.7
billion for 2010 compared to 2009. The increase was due to the
impact of deposit pricing and the adoption of new consolidation
guidance which contributed $10.5 billion to net interest income
in 2010. The increase was partially offset by lower commercial
and consumer loan levels, the sale of First Republic in 2010 and
lower rates on core assets and trading assets and liabilities,
including derivative exposures. The net interest yield on a FTE
basis increased 13 bps to 2.78 percent for 2010 compared to
2009 due to the factors described above.
Noninterest Income
Noninterest income decreased $13.8 billion to $58.7 billion in
2010 compared to 2009. Card income decreased $245 million
due to the implementation of the CARD Act partially offset by the
impact of the new consolidation guidance and higher interchange
income. Service charges decreased $1.6 billion largely due to the
impact of overdraft policy changes in conjunction with Regulation
E, which became effective in the third quarter of 2010 and the
impact of our overdraft policy changes implemented in late 2009.
Equity investment income decreased $4.8 billion, as net gains on
the sales of certain strategic investments during 2010 were less
than gains in 2009 that included a $7.3 billion gain related to the
sale of a portion of our investment in CCB. Trading account profits
decreased $2.2 billion due to more favorable market conditions
in 2009 and investor concerns regarding sovereign debt fears and
regulatory uncertainty. DVA gains, net of hedges, on derivative
liabilities of $262 million for 2010 compared to losses of $662
million for 2009. Mortgage banking income decreased $6.1 billion
due to an increase of $4.9 billion in representations and warranties
provision and lower volume and margins. Gains on sales of debt
securities decreased $2.2 billion driven by a lower volume of sales
of debt securities. The decrease also included the impact of losses
in 2010 related to portfolio restructuring activities. Other income
(loss) improved by $2.4 billion. 2009 included a net negative fair
value adjustment related to our own credit of $4.9 billion on
structured liabilities compared to a net positive adjustment of $18
million in 2010, and 2009 also included a $3.8 billion gain on the
contribution of our merchant services business to a joint venture.
Legacy asset write-downs included in other income (loss) were
$1.7 billion in 2009 compared to net gains of $256 million in
2010. Impairment losses recognized in earnings on AFS debt
securities decreased $1.9 billion reflecting lower impairment write-
downs on non-agency RMBS and CDOs.
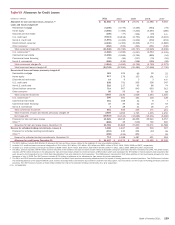
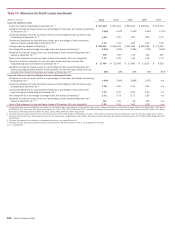
Provision for Credit Losses
The provision for credit losses decreased $20.1 billion to $28.4
billion for 2010 compared to 2009 due to improving portfolio
trends across the consumer and commercial portfolios. Net
charge-offs totaled $34.3 billion, or 3.60 percent of average loans
and leases for 2010 compared to $33.7 billion, or 3.58 percent
for 2009.
Noninterest Expense
Noninterest expense increased $16.4 billion to $83.1 billion for
2010 compared to 2009 largely due to goodwill impairment
charges of $12.4 billion. The increase was also driven by a $3.6
billion increase in personnel costs reflecting the build out of several
businesses, the recognition of expense on proportionally larger
2009 incentive deferrals and the U.K. payroll tax on certain year-
end incentive payments, as well as a $1.6 billion increase in
litigation costs. These increases were partially offset by a $901
million decline in merger and restructuring charges compared to
2009. Noninterest expense for 2009 included a special FDIC
assessment of $724 million.
Income Tax Expense
Income tax expense was $915 million for 2010 compared to a
benefit of $1.9 billion for 2009. The effective tax rate in 2010 was
not meaningful due to the impact of non-deductible goodwill
impairment charges of $12.4 billion. The effective tax rate for
2010 excluding goodwill impairment charges was 8.3 percent
compared to (44.0) percent in 2009. The change in the effective
tax rate from the prior year was primarily driven by an increase in
pre-tax income excluding the non-deductible goodwill impairment
charges. Also impacting the 2010 effective tax rate was a $392
million charge from a U.K. law change and a $1.7 billion tax benefit
from the release of a portion of the deferred tax asset valuation
allowance related to acquired capital loss carryforward tax benefits
compared to $650 million in 2009.
Business Segment Operations
Deposits
Net income decreased $1.3 billion to $1.4 billion in 2010 due to
a decline in revenue and higher noninterest expense. Net interest
income increased $1.1 billion to $8.3 billion as a result of a
customer shift to more liquid products and continued pricing
discipline, partially offset by a lower net interest income allocation
related to ALM activities. Noninterest income decreased $1.8
billion to $5.3 billion driven by the impact of overdraft policy
changes in conjunction with Regulation E, which was effective in
the third quarter of 2010, and our overdraft policy changes
implemented in late 2009. Noninterest expense increased $1.5
billion to $11.2 billion as a higher proportion of banking center
sales and service costs was aligned to Deposits from the other
segments, and increased litigation expenses partially offset by a
decrease in FDIC expenses as 2009 included a special
assessment.