Bank of America 2011 Annual Report Download - page 244
Download and view the complete annual report
Please find page 244 of the 2011 Bank of America annual report below. You can navigate through the pages in the report by either clicking on the pages listed below, or by using the keyword search tool below to find specific information within the annual report.-
 1
1 -
2
-
3
-
4
-
5
-
6
-
7
-
8
-
9
-
10
-
11
-
12
-
13
-
14
-
15
-
16
-
17
-
18
-
19
-
20
-
21
-
22
-
23
-
24
-
25
-
26
-
27
-
28
-
29
-
30
-
31
-
32
-
33
-
34
-
35
-
36
-
37
-
38
-
39
-
40
-
41
-
42
-
43
-
44
-
45
-
46
-
47
-
48
-
49
-
50
-
51
-
52
-
53
-
54
-
55
-
56
-
57
-
58
-
59
-
60
-
61
-
62
-
63
-
64
-
65
-
66
-
67
-
68
-
69
-
70
-
71
-
72
-
73
-
74
-
75
-
76
-
77
-
78
-
79
-
80
-
81
-
82
-
83
-
84
-
85
-
86
-
87
-
88
-
89
-
90
-
91
-
92
-
93
-
94
-
95
-
96
-
97
-
98
-
99
-
100
-
101
-
102
-
103
-
104
-
105
-
106
-
107
-
108
-
109
-
110
-
111
-
112
-
113
-
114
-
115
-
116
-
117
-
118
-
119
-
120
-
121
-
122
-
123
-
124
-
125
-
126
-
127
-
128
-
129
-
130
-
131
-
132
-
133
-
134
-
135
-
136
-
137
-
138
-
139
-
140
-
141
-
142
-
143
-
144
-
145
-
146
-
147
-
148
-
149
-
150
-
151
-
152
-
153
-
154
-
155
-
156
-
157
-
158
-
159
-
160
-
161
-
162
-
163
-
164
-
165
-
166
-
167
-
168
-
169
-
170
-
171
-
172
-
173
-
174
-
175
-
176
-
177
-
178
-
179
-
180
-
181
-
182
-
183
-
184
-
185
-
186
-
187
-
188
-
189
-
190
-
191
-
192
-
193
-
194
-
195
-
196
-
197
-
198
-
199
-
200
-
201
-
202
-
203
-
204
-
205
-
206
-
207
-
208
-
209
-
210
-
211
-
212
-
213
-
214
-
215
-
216
-
217
-
218
-
219
-
220
-
221
-
222
-
223
-
224
-
225
-
226
-
227
-
228
-
229
-
230
-
231
-
232
-
233
-
 234
234 -
 235
235 -
 236
236 -
 237
237 -
 238
238 -
 239
239 -
 240
240 -
 241
241 -
 242
242 -
 243
243 -
 244
244 -
 245
245 -
 246
246 -
 247
247 -
 248
248 -
 249
249 -
 250
250 -
 251
251 -
 252
252 -
 253
253 -
 254
254 -
255
-
256
-
257
-
258
-
259
-
260
-
261
-
262
-
263
-
264
-
265
-
266
-
267
-
268
-
269
-
270
-
271
-
272
-
273
-
274
-
275
-
276
 |
 |

242 Bank of America 2011
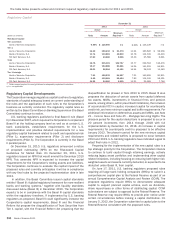
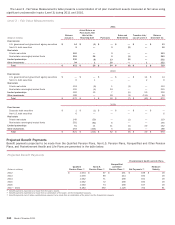
The Level 3 - Fair Value Measurements table presents a reconciliation of all plan investment assets measured at fair value using
significant unobservable inputs (Level 3) during 2011 and 2010.
Level 3 – Fair Value Measurements
(Dollars in millions)
Fixed income
U.S. government and government agency securities
Non-U.S. debt securities
Real estate
Private real estate
Real estate commingled/mutual funds
Limited partnerships
Other investments
Total
Fixed income
U.S. government and government agency securities
Non-U.S. debt securities
Real estate
Private real estate
Real estate commingled/mutual funds
Limited partnerships
Other investments
Total
Fixed income
Corporate debt securities
Non-U.S. debt securities
Real estate
Private real estate
Real estate commingled/mutual funds
Limited partnerships
Other investments
Total
2011
Balance
January 1
$14
9
110
215
230
94
$ 672
2010
$—
6
119
195
162
188
$ 670
2009
$1
6
149
281
91
293
$ 821
Actual Return on
Plan Assets Still
Held at the
Reporting Date
$(1)
—
—
26
(6)
1
$20
$—
1
(9)
(4)
13
—
$1
$ (1)
—
(29)
(92)
14
(106)
$ (214)
Purchases
$—
3
3
9
13
26
$54
$—
—
1
24
7
18
$50
$—
—
—
6
41
5
$5
2
Sales and
Settlements
$—
(2)
—
(1)
(5)
—
$(8)
$—
—
(1)
—
(5)
(1)
$ (7)
$—
—
(1)
—
(4)
(4)
$ (9)
Transfers into/
(out of) Level 3
$—
—
—
—
—
1
$1
$14
2
—
—
53
(111)
$ (42)
$—
—
—
—
20
—
$20
Balance
December 31
$13
10
113
249
232
122
$ 739
$14
9
110
215
230
94
$ 672
$—
6
119
195
162
188
$ 670
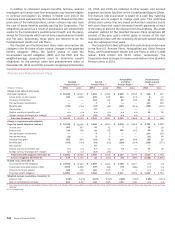
Projected Benefit Payments
Benefit payments projected to be made from the Qualified Pension Plans, Non-U.S. Pension Plans, Nonqualified and Other Pension
Plans, and Postretirement Health and Life Plans are presented in the table below.
Projected Benefit Payments
(Dollars in millions)
2012
2013
2014
2015
2016
2017 – 2021
Qualified
Pension Plans (1)
$ 1,054
1,059
1,062
1,062
1,060
5,283
Non-U.S.
Pension Plans (2)
$67
69
71
72
74
392
Nonqualified
and Other
Pension Plans (2)
$ 251
244
238
238
238
1,128
Postretirement Health and Life Plans
Net Payments (3)
$ 159
160
161
160
157
702
Medicare
Subsidy
$18
18
18
18
18
81
(1) Benefit payments expected to be made from the plans’ assets.
(2) Benefit payments expected to be made from a combination of the plans’ and the Corporation’s assets.
(3) Benefit payments (net of retiree contributions) expected to be made from a combination of the plans’ and the Corporation’s assets.