Bank of America 2011 Annual Report Download - page 40
Download and view the complete annual report
Please find page 40 of the 2011 Bank of America annual report below. You can navigate through the pages in the report by either clicking on the pages listed below, or by using the keyword search tool below to find specific information within the annual report.-
 1
1 -
2
-
3
-
4
-
5
-
6
-
7
-
8
-
9
-
10
-
11
-
12
-
13
-
14
-
15
-
16
-
17
-
18
-
19
-
20
-
21
-
22
-
23
-
24
-
25
-
26
-
27
-
28
-
29
-
 30
30 -
 31
31 -
 32
32 -
 33
33 -
 34
34 -
 35
35 -
 36
36 -
 37
37 -
 38
38 -
 39
39 -
 40
40 -
 41
41 -
 42
42 -
 43
43 -
 44
44 -
 45
45 -
 46
46 -
 47
47 -
 48
48 -
 49
49 -
 50
50 -
51
-
52
-
53
-
54
-
55
-
56
-
57
-
58
-
59
-
60
-
61
-
62
-
63
-
64
-
65
-
66
-
67
-
68
-
69
-
70
-
71
-
72
-
73
-
74
-
75
-
76
-
77
-
78
-
79
-
80
-
81
-
82
-
83
-
84
-
85
-
86
-
87
-
88
-
89
-
90
-
91
-
92
-
93
-
94
-
95
-
96
-
97
-
98
-
99
-
100
-
101
-
102
-
103
-
104
-
105
-
106
-
107
-
108
-
109
-
110
-
111
-
112
-
113
-
114
-
115
-
116
-
117
-
118
-
119
-
120
-
121
-
122
-
123
-
124
-
125
-
126
-
127
-
128
-
129
-
130
-
131
-
132
-
133
-
134
-
135
-
136
-
137
-
138
-
139
-
140
-
141
-
142
-
143
-
144
-
145
-
146
-
147
-
148
-
149
-
150
-
151
-
152
-
153
-
154
-
155
-
156
-
157
-
158
-
159
-
160
-
161
-
162
-
163
-
164
-
165
-
166
-
167
-
168
-
169
-
170
-
171
-
172
-
173
-
174
-
175
-
176
-
177
-
178
-
179
-
180
-
181
-
182
-
183
-
184
-
185
-
186
-
187
-
188
-
189
-
190
-
191
-
192
-
193
-
194
-
195
-
196
-
197
-
198
-
199
-
200
-
201
-
202
-
203
-
204
-
205
-
206
-
207
-
208
-
209
-
210
-
211
-
212
-
213
-
214
-
215
-
216
-
217
-
218
-
219
-
220
-
221
-
222
-
223
-
224
-
225
-
226
-
227
-
228
-
229
-
230
-
231
-
232
-
233
-
234
-
235
-
236
-
237
-
238
-
239
-
240
-
241
-
242
-
243
-
244
-
245
-
246
-
247
-
248
-
249
-
250
-
251
-
252
-
253
-
254
-
255
-
256
-
257
-
258
-
259
-
260
-
261
-
262
-
263
-
264
-
265
-
266
-
267
-
268
-
269
-
270
-
271
-
272
-
273
-
274
-
275
-
276
 |
 |
38 Bank of America 2011
Home Loans includes ongoing loan production activities,
certain servicing activities and the CRES home equity portfolio not
originally selected for inclusion in the Legacy Asset Servicing
portfolio. Servicing activities include collecting cash for principal,
interest and escrow payments from borrowers, and disbursing
customer draws for lines of credit and accounting for and remitting
principal and interest payments to investors and escrow payments
to third parties along with responding to non-default related
customer inquiries. Home Loans also included insurance
operations through June 30, 2011, when the ongoing insurance
business was transferred to Card Services following the sale of
Balboa.
Due to the realignment of CRES, the composition of the Home
Loans loan portfolio does not currently reflect a normalized level
of credit losses and noninterest expense which we expect will
develop over time.
Legacy Asset Servicing
Legacy Asset Servicing is responsible for servicing and managing
the exposures related to selected residential mortgage, home
equity and discontinued real estate loan portfolios. These selected
loan portfolios include owned loans and loans serviced for others,
including loans held in other business segments and All Other
(collectively, the Legacy Asset Servicing portfolio). The Legacy
Asset Servicing portfolio includes residential mortgage loans,
home equity loans and discontinued real estate loans that would
not have been originated under our underwriting standards at
December 31, 2010. Countrywide loans that were impaired at the
time of acquisition (the Countrywide PCI portfolio) as well as
certain loans that met a pre-defined delinquency status or
probability of default threshold as of January 1, 2011 are also
included in the Legacy Asset Servicing portfolio. Since determining
the pool of loans to be included in the Legacy Asset Servicing
portfolio as of January 1, 2011, the criteria have not changed for
this portfolio. However, the criteria for inclusion of certain assets
and liabilities in the Legacy Asset Servicing portfolio will continue
to be evaluated over time.
Legacy Asset Servicing results reflect the net cost of legacy
exposures that is included in the results of CRES, including
representations and warranties provision, litigation costs, and
financial results of the CRES home equity portfolio selected as
part of the Legacy Asset Servicing portfolio. In addition, certain
revenues and expenses on loans serviced for others, including
loans serviced for other business segments and All Other, are
included in Legacy Asset Servicing results. The results of the
Legacy Asset Servicing residential mortgage and discontinued real
estate portfolios are recorded primarily in All Other.
Our home retention efforts are part of our servicing activities,
along with supervising foreclosures and property dispositions.
These default-related activities are performed by Legacy Asset
Servicing. In an effort to help our customers avoid foreclosure,
Legacy Asset Servicing evaluates various workout options prior to
foreclosure sales which, combined with our temporary halt of
foreclosures announced in October 2010, has resulted in
elongated default timelines. For additional information on our
servicing activities and foreclosures, see Off-Balance Sheet
Arrangements and Contractual Obligations – Other Mortgage-
related Matters on page 57.
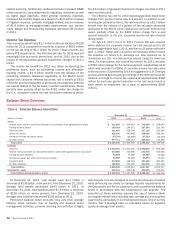
The total owned loans in the Legacy Asset Servicing portfolio
decreased $15.7 billion in 2011 to $154.9 billion at December 31,
2011, of which $60.0 billion are reflected on the balance sheet
of Legacy Asset Servicing within CRES and the remainder are held
on the balance sheet of All Other.
Other
The Other component within CRES includes the results of MSR
activities, including net hedge results, together with any related
assets or liabilities used as economic hedges. The change in the
value of the MSRs reflects the change in discount rates and
prepayment speed assumptions, as well as the effect of changes
in other assumptions, including the cost to service. These amounts
are not allocated between Home Loans and Legacy Asset Servicing
since the MSRs are managed as a single asset. For additional
information on MSRs, see Note 25 – Mortgage Servicing Rights to
the Consolidated Financial Statements. Goodwill assigned to CRES
was included in Other; however, the remaining balance of goodwill
was written off in its entirety in 2011.
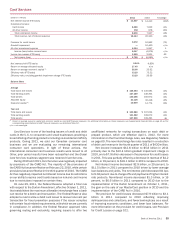
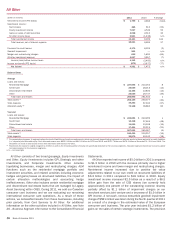
CRES Results
The CRES net loss increased $10.6 billion to $19.5 billion in 2011
compared to 2010. Revenue declined $13.5 billion to a loss of
$3.2 billion due in large part to a decrease of $11.4 billion in
mortgage banking income driven by an increase in representations
and warranties provision of $8.8 billion and a decrease in core
production income of $3.4 billion in 2011.
The representations and warranties provision in 2011 included
$8.6 billion related to the BNY Mellon Settlement and $7.0 billion
related to other exposures. For additional information on
representations and warranties, see Off-Balance Sheet
Arrangements and Contractual Obligations – Representations and
Warranties on page 50 and Note 9 – Representations and
Warranties Obligations and Corporate Guarantees to the
Consolidated Financial Statements. The decrease in core
production income was due to a decline in loan funding volume
caused primarily by a drop in market share, which reflected
decisions to price certain loan products in order to align the volume
of new loan applications with our underwriting capacity in both the
retail and correspondent channels and our exit from the
correspondent channel in late 2011. Also contributing to the
decline in revenue was a $1.3 billion decrease in insurance income
due to the sale of Balboa in 2011 and a decline in net interest
income primarily due to lower average LHFS balances. Revenue
for 2011 also included a pre-tax gain on the sale of Balboa of
$752 million, net of an inter-segment advisory fee.
The provision for credit losses decreased $4.0 billion to $4.5
billion in 2011 compared to 2010 driven primarily by improving
portfolio trends, including lower reserve additions in the
Countrywide PCI home equity portfolio.
Noninterest expense increased $7.0 billion to $21.9 billion in
2011 compared to 2010 primarily due to a $3.6 billion increase
in litigation expense, $1.6 billion higher mortgage-related
assessments and waivers costs, higher default-related and other
loss mitigation servicing expenses and a non-cash, non-tax
deductible goodwill impairment charge of $2.6 billion in 2011
compared to a $2.0 billion goodwill impairment charge in 2010.
In 2011, we recorded $1.8 billion of mortgage-related
assessments and waivers costs, which included $1.3 billion for
compensatory fees as a result of elongated default timelines.
These increases were partially offset by a decrease of $1.1 billion
in insurance expense due to the sale of Balboa and a decline of
$640 million in production expense primarily due to lower
origination volumes.