Bank of America 2011 Annual Report Download - page 50
Download and view the complete annual report
Please find page 50 of the 2011 Bank of America annual report below. You can navigate through the pages in the report by either clicking on the pages listed below, or by using the keyword search tool below to find specific information within the annual report.-
 1
1 -
2
-
3
-
4
-
5
-
6
-
7
-
8
-
9
-
10
-
11
-
12
-
13
-
14
-
15
-
16
-
17
-
18
-
19
-
20
-
21
-
22
-
23
-
24
-
25
-
26
-
27
-
28
-
29
-
30
-
31
-
32
-
33
-
34
-
35
-
36
-
37
-
38
-
39
-
 40
40 -
 41
41 -
 42
42 -
 43
43 -
 44
44 -
 45
45 -
 46
46 -
 47
47 -
 48
48 -
 49
49 -
 50
50 -
 51
51 -
 52
52 -
 53
53 -
 54
54 -
 55
55 -
 56
56 -
 57
57 -
 58
58 -
 59
59 -
 60
60 -
61
-
62
-
63
-
64
-
65
-
66
-
67
-
68
-
69
-
70
-
71
-
72
-
73
-
74
-
75
-
76
-
77
-
78
-
79
-
80
-
81
-
82
-
83
-
84
-
85
-
86
-
87
-
88
-
89
-
90
-
91
-
92
-
93
-
94
-
95
-
96
-
97
-
98
-
99
-
100
-
101
-
102
-
103
-
104
-
105
-
106
-
107
-
108
-
109
-
110
-
111
-
112
-
113
-
114
-
115
-
116
-
117
-
118
-
119
-
120
-
121
-
122
-
123
-
124
-
125
-
126
-
127
-
128
-
129
-
130
-
131
-
132
-
133
-
134
-
135
-
136
-
137
-
138
-
139
-
140
-
141
-
142
-
143
-
144
-
145
-
146
-
147
-
148
-
149
-
150
-
151
-
152
-
153
-
154
-
155
-
156
-
157
-
158
-
159
-
160
-
161
-
162
-
163
-
164
-
165
-
166
-
167
-
168
-
169
-
170
-
171
-
172
-
173
-
174
-
175
-
176
-
177
-
178
-
179
-
180
-
181
-
182
-
183
-
184
-
185
-
186
-
187
-
188
-
189
-
190
-
191
-
192
-
193
-
194
-
195
-
196
-
197
-
198
-
199
-
200
-
201
-
202
-
203
-
204
-
205
-
206
-
207
-
208
-
209
-
210
-
211
-
212
-
213
-
214
-
215
-
216
-
217
-
218
-
219
-
220
-
221
-
222
-
223
-
224
-
225
-
226
-
227
-
228
-
229
-
230
-
231
-
232
-
233
-
234
-
235
-
236
-
237
-
238
-
239
-
240
-
241
-
242
-
243
-
244
-
245
-
246
-
247
-
248
-
249
-
250
-
251
-
252
-
253
-
254
-
255
-
256
-
257
-
258
-
259
-
260
-
261
-
262
-
263
-
264
-
265
-
266
-
267
-
268
-
269
-
270
-
271
-
272
-
273
-
274
-
275
-
276
 |
 |

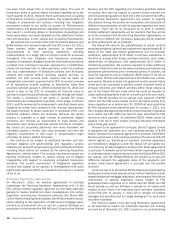
48 Bank of America 2011
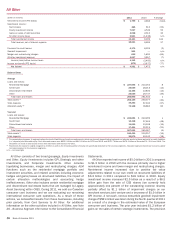
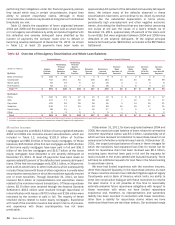
All Other
(Dollars in millions)
Net interest income (FTE basis)
Noninterest income:
Card income
Equity investment income
Gains on sales of debt securities
All other income (loss)
Total noninterest income
Total revenue, net of interest expense
Provision for credit losses
Goodwill impairment
Merger and restructuring charges
All other noninterest expense
Income (loss) before income taxes
Income tax benefit (FTE basis)
Net income
Balance Sheet
Average
Loans and leases:
Residential Mortgage
Credit Card
Discontinued real estate
Other
Total loans and leases
Total assets (1)
Total deposits
Allocated equity (2)
Year end
Loans and leases:
Residential Mortgage
Credit Card
Discontinued real estate
Other
Total loans and leases
Total assets (1)
Total deposits
2011
$ 1,780
465
7,037
3,098
2,821
13,421
15,201
6,173
581
638
3,697
4,112
(879)
$ 4,991
$ 227,696
24,049
12,106
20,039
283,890
205,189
49,283
72,128
$ 224,654
14,418
11,095
17,454
267,621
180,435
32,870
2010
$ 3,656
615
4,549
2,313
(1,438)
6,039
9,695
6,323
—
1,820
3,957
(2,405)
(3,877)
$ 1,472
$210,052
28,013
13,830
29,747
281,642
293,577
67,945
38,884
$222,299
27,465
13,108
22,215
285,087
210,257
40,142
% Change
(51)%
(24)
55
34
n/m
122
57
(2)
n/m
(65)
(7)
n/m
(77)
n/m
8
(14)
(12)
(33)
1
(30)
(27)
85
1
(48)
(15)
(21)
(6)
(14)
(18)
(1) For presentation purposes, in segments where the total of liabilities and equity exceeds assets, which are generally deposit-taking segments, we allocate assets to those segments to match liabilities
(i.e., deposits) and allocated equity. Such allocated assets were $662.2 billion and $613.3 billion for 2011 and 2010, and $531.7 billion and $476.5 billion at December 31, 2011 and 2010. The
allocation can result in total assets of less than total loans and leases in All Other.
(2) Represents the economic capital assigned to All Other as well as the remaining portion of equity not specifically allocated to the business segments. Allocated equity increased due to excess capital
not being assigned to the business segments.
n/m = not meaningful
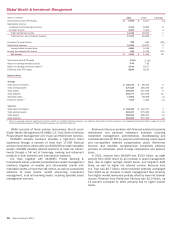
All Other consists of two broad groupings, Equity Investments
and Other. Equity Investments includes GPI, Strategic and other
investments, and Corporate Investments. Other includes
liquidating businesses, merger and restructuring charges, ALM
functions such as the residential mortgage portfolio and
investment securities, and related activities including economic
hedges and gains/losses on structured liabilities, the impact of
certain allocation methodologies and accounting hedge
ineffectiveness. Other also includes certain residential mortgage
and discontinued real estate loans that are managed by Legacy
Asset Servicing within CRES. During 2011, we sold our Canadian
consumer card business and we are evaluating our remaining
international consumer card operations. As a result of these
actions, we reclassified results from these businesses, including
prior periods, from Card Services to All Other. For additional
information on the other activities included in All Other, see Note
26 – Business Segment Information to the Consolidated Financial
Statements.
All Other reported net income of $5.0 billion in 2011 compared
to $1.5 billion in 2010 with the increase primarily due to higher
noninterest income and lower merger and restructuring charges.
Noninterest income increased due to positive fair value
adjustments related to our own credit on structured liabilities of
$3.3 billion in 2011 compared to $18 million in 2010. Equity
investment income increased $2.5 billion as a result of a $6.5
billion gain from the sale of CCB shares (we currently hold
approximately one percent of the outstanding common shares)
partially offset by $1.1 billion of impairment charges on our
merchant services joint venture and a decrease of $1.9 billion in
GPI income. A non-cash, non-tax deductible goodwill impairment
charge of $581 million was taken during the fourth quarter of 2011
as a result of a change in the estimated value of the European
consumer card business. The prior year included $1.2 billion of
gains on the sales of certain strategic investments. The provision