Bank of America 2011 Annual Report Download - page 71
Download and view the complete annual report
Please find page 71 of the 2011 Bank of America annual report below. You can navigate through the pages in the report by either clicking on the pages listed below, or by using the keyword search tool below to find specific information within the annual report.-
 1
1 -
2
-
3
-
4
-
5
-
6
-
7
-
8
-
9
-
10
-
11
-
12
-
13
-
14
-
15
-
16
-
17
-
18
-
19
-
20
-
21
-
22
-
23
-
24
-
25
-
26
-
27
-
28
-
29
-
30
-
31
-
32
-
33
-
34
-
35
-
36
-
37
-
38
-
39
-
40
-
41
-
42
-
43
-
44
-
45
-
46
-
47
-
48
-
49
-
50
-
51
-
52
-
53
-
54
-
55
-
56
-
57
-
58
-
59
-
60
-
 61
61 -
 62
62 -
 63
63 -
 64
64 -
 65
65 -
 66
66 -
 67
67 -
 68
68 -
 69
69 -
 70
70 -
 71
71 -
 72
72 -
 73
73 -
 74
74 -
 75
75 -
 76
76 -
 77
77 -
 78
78 -
 79
79 -
 80
80 -
 81
81 -
82
-
83
-
84
-
85
-
86
-
87
-
88
-
89
-
90
-
91
-
92
-
93
-
94
-
95
-
96
-
97
-
98
-
99
-
100
-
101
-
102
-
103
-
104
-
105
-
106
-
107
-
108
-
109
-
110
-
111
-
112
-
113
-
114
-
115
-
116
-
117
-
118
-
119
-
120
-
121
-
122
-
123
-
124
-
125
-
126
-
127
-
128
-
129
-
130
-
131
-
132
-
133
-
134
-
135
-
136
-
137
-
138
-
139
-
140
-
141
-
142
-
143
-
144
-
145
-
146
-
147
-
148
-
149
-
150
-
151
-
152
-
153
-
154
-
155
-
156
-
157
-
158
-
159
-
160
-
161
-
162
-
163
-
164
-
165
-
166
-
167
-
168
-
169
-
170
-
171
-
172
-
173
-
174
-
175
-
176
-
177
-
178
-
179
-
180
-
181
-
182
-
183
-
184
-
185
-
186
-
187
-
188
-
189
-
190
-
191
-
192
-
193
-
194
-
195
-
196
-
197
-
198
-
199
-
200
-
201
-
202
-
203
-
204
-
205
-
206
-
207
-
208
-
209
-
210
-
211
-
212
-
213
-
214
-
215
-
216
-
217
-
218
-
219
-
220
-
221
-
222
-
223
-
224
-
225
-
226
-
227
-
228
-
229
-
230
-
231
-
232
-
233
-
234
-
235
-
236
-
237
-
238
-
239
-
240
-
241
-
242
-
243
-
244
-
245
-
246
-
247
-
248
-
249
-
250
-
251
-
252
-
253
-
254
-
255
-
256
-
257
-
258
-
259
-
260
-
261
-
262
-
263
-
264
-
265
-
266
-
267
-
268
-
269
-
270
-
271
-
272
-
273
-
274
-
275
-
276
 |
 |

Bank of America 2011 69
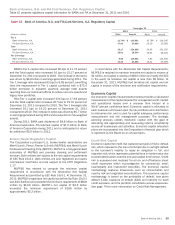
Bank of America, N.A. and FIA Card Services, N.A. Regulatory Capital
Table 15 presents regulatory capital information for BANA and FIA at December 31, 2011 and 2010.
Table 15
(Dollars in millions)
Tier 1
Bank of America, N.A.
FIA Card Services, N.A.
Total
Bank of America, N.A.
FIA Card Services, N.A.
Tier 1 leverage
Bank of America, N.A.
FIA Card Services, N.A.
Bank of America, N.A. and FIA Card Services, N.A. Regulatory Capital
December 31
2011
Ratio
11.74%
17.63
15.17
19.01
8.65
14.22
Amount
$ 119,881
24,660
154,885
26,594
119,881
24,660
2010
Ratio
10.78%
15.30
14.26
16.94
7.83
13.21
Amount
$ 114,345
25,589
151,255
28,343
114,345
25,589
BANA’s Tier 1 capital ratio increased 96 bps to 11.74 percent
and the Total capital ratio increased 91 bps to 15.17 percent at
December 31, 2011 compared to 2010. The increase in the ratios
was driven by $9.6 billion in earnings generated during 2011. The
Tier 1 leverage ratio increased 82 bps to 8.65 percent, benefiting
from the improvement in Tier 1 capital combined with a $73.4
billion decrease in adjusted quarterly average total assets
resulting from our continued efforts to reduce non-core assets and
legacy loan portfolios.
FIA’s Tier 1 capital ratio increased 233 bps to 17.63 percent
and the Total capital ratio increased 207 bps to 19.01 percent at
December 31, 2011 compared to 2010. The Tier 1 leverage ratio
increased 101 bps to 14.22 percent at December 31, 2011
compared to 2010. The increase in ratios was driven by $5.7 billion
in earnings generated during 2011 and a reduction in risk-weighted
assets.
During 2011, BANA paid dividends of $9.8 billion to Bank of
America Corporation. FIA returned capital of $7.0 billion to Bank
of America Corporation during 2011 and is anticipated to return
an additional $3.0 billion in 2012.
Broker/Dealer Regulatory Capital
The Corporation’s principal U.S. broker/dealer subsidiaries are
Merrill Lynch, Pierce, Fenner & Smith (MLPF&S) and Merrill Lynch
Professional Clearing Corp (MLPCC). MLPCC is a fully-guaranteed
subsidiary of MLPF&S and provides clearing and settlement
services. Both entities are subject to the net capital requirements
of SEC Rule 15c3-1. Both entities are also registered as futures
commission merchants and are subject to the CFTC Regulation
1.17.
MLPF&S has elected to compute the minimum capital
requirement in accordance with the Alternative Net Capital
Requirement as permitted by SEC Rule 15c3-1. At December 31,
2011, MLPF&S’s regulatory net capital as defined by Rule 15c3-1
was $10.8 billion and exceeded the minimum requirement of $803
million by $10.0 billion. MLPCC’s net capital of $3.5 billion
exceeded the minimum requirement of $168 million by
approximately $3.3 billion.
In accordance with the Alternative Net Capital Requirements,
MLPF&S is required to maintain tentative net capital in excess of
$1 billion, net capital in excess of $500 million and notify the SEC
in the event its tentative net capital is less than $5 billion. At
December 31, 2011, MLPF&S had tentative net capital and net
capital in excess of the minimum and notification requirements.
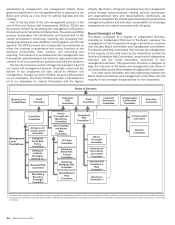
Economic Capital
Our economic capital measurement process provides a risk-based
measurement of the capital required for unexpected credit, market
and operational losses over a one-year time horizon at a
99.97 percent confidence level. Economic capital is allocated to
each business unit based upon its risk positions and contribution
to enterprise risk, and is used for capital adequacy, performance
measurement and risk management purposes. The strategic
planning process utilizes economic capital with the goal of
allocating risk appropriately and measuring returns consistently
across all businesses and activities. Economic capital allocation
plans are incorporated into the Corporation’s financial plan which
is approved by the Board on an annual basis.
Credit Risk Capital
Economic capital for credit risk captures two types of risks: default
risk, which represents the loss of principal due to outright default
or the borrower’s inability to repay an obligation in full, and
migration risk, which represents potential loss in market value due
to credit deterioration over the one-year capital time horizon. Credit
risk is assessed and modeled for all on- and off-balance sheet
credit exposures within sub-categories for commercial, retail,
counterparty and investment securities. The economic capital
methodology captures dimensions such as concentration and
country risk and originated securitizations. The economic capital
methodology is based on the probability of default, loss given
default (LGD), exposure at default (EAD) and maturity for each
credit exposure, and the portfolio correlations across exposures.
See page 74 for more information on Credit Risk Management.