Bank of America 2011 Annual Report Download - page 88
Download and view the complete annual report
Please find page 88 of the 2011 Bank of America annual report below. You can navigate through the pages in the report by either clicking on the pages listed below, or by using the keyword search tool below to find specific information within the annual report.-
 1
1 -
2
-
3
-
4
-
5
-
6
-
7
-
8
-
9
-
10
-
11
-
12
-
13
-
14
-
15
-
16
-
17
-
18
-
19
-
20
-
21
-
22
-
23
-
24
-
25
-
26
-
27
-
28
-
29
-
30
-
31
-
32
-
33
-
34
-
35
-
36
-
37
-
38
-
39
-
40
-
41
-
42
-
43
-
44
-
45
-
46
-
47
-
48
-
49
-
50
-
51
-
52
-
53
-
54
-
55
-
56
-
57
-
58
-
59
-
60
-
61
-
62
-
63
-
64
-
65
-
66
-
67
-
68
-
69
-
70
-
71
-
72
-
73
-
74
-
75
-
76
-
77
-
 78
78 -
 79
79 -
 80
80 -
 81
81 -
 82
82 -
 83
83 -
 84
84 -
 85
85 -
 86
86 -
 87
87 -
 88
88 -
 89
89 -
 90
90 -
 91
91 -
 92
92 -
 93
93 -
 94
94 -
 95
95 -
 96
96 -
 97
97 -
 98
98 -
99
-
100
-
101
-
102
-
103
-
104
-
105
-
106
-
107
-
108
-
109
-
110
-
111
-
112
-
113
-
114
-
115
-
116
-
117
-
118
-
119
-
120
-
121
-
122
-
123
-
124
-
125
-
126
-
127
-
128
-
129
-
130
-
131
-
132
-
133
-
134
-
135
-
136
-
137
-
138
-
139
-
140
-
141
-
142
-
143
-
144
-
145
-
146
-
147
-
148
-
149
-
150
-
151
-
152
-
153
-
154
-
155
-
156
-
157
-
158
-
159
-
160
-
161
-
162
-
163
-
164
-
165
-
166
-
167
-
168
-
169
-
170
-
171
-
172
-
173
-
174
-
175
-
176
-
177
-
178
-
179
-
180
-
181
-
182
-
183
-
184
-
185
-
186
-
187
-
188
-
189
-
190
-
191
-
192
-
193
-
194
-
195
-
196
-
197
-
198
-
199
-
200
-
201
-
202
-
203
-
204
-
205
-
206
-
207
-
208
-
209
-
210
-
211
-
212
-
213
-
214
-
215
-
216
-
217
-
218
-
219
-
220
-
221
-
222
-
223
-
224
-
225
-
226
-
227
-
228
-
229
-
230
-
231
-
232
-
233
-
234
-
235
-
236
-
237
-
238
-
239
-
240
-
241
-
242
-
243
-
244
-
245
-
246
-
247
-
248
-
249
-
250
-
251
-
252
-
253
-
254
-
255
-
256
-
257
-
258
-
259
-
260
-
261
-
262
-
263
-
264
-
265
-
266
-
267
-
268
-
269
-
270
-
271
-
272
-
273
-
274
-
275
-
276
 |
 |

86 Bank of America 2011
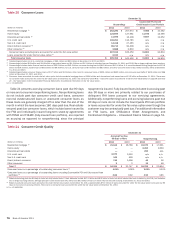
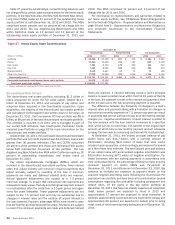
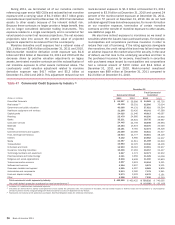
Table 35 presents certain state concentrations for the direct/indirect consumer loan portfolio.
Table 35
(Dollars in millions)
California
Texas
Florida
New York
Georgia
Other U.S./Non-U.S.
Total direct/indirect loan portfolio
Direct/Indirect State Concentrations
December 31
Outstandings
2011
$ 11,152
7,882
7,456
5,160
2,828
55,235
$ 89,713
2010
$ 10,558
7,885
6,725
4,770
2,814
57,556
$ 90,308
Accruing Past Due
90 Days or More
2011
$81
54
55
40
38
478
$746
2010
$ 132
78
80
56
44
668
$ 1,058
Net Charge-offs
2011
$222
117
148
79
61
849
$ 1,476
2010
$ 591
262
343
183
126
1,831
$ 3,336
Other Consumer
At December 31, 2011, approximately 96 percent of the $2.7
billion other consumer portfolio was associated with certain
consumer finance businesses that we previously exited and non-
U.S. consumer loan portfolios that are included in All Other. The
remainder is primarily deposit overdrafts in Deposits.
Consumer Loans Accounted for Under the Fair Value
Option
Outstanding consumer loans accounted for under the fair value
option were $2.2 billion at December 31, 2011 and include $1.3
billion of discontinued real estate loans and $906 million of
residential mortgage loans as a result of the consolidation of VIEs.
During 2011, we recorded losses of $837 million resulting from
changes in the fair value of the loan portfolio. These losses were
offset by gains recorded on the related long-term debt.
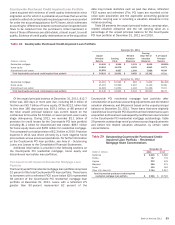
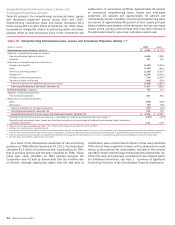
Nonperforming Consumer Loans and Foreclosed
Properties Activity
Table 36 presents nonperforming consumer loans and foreclosed
properties activity during 2011 and 2010. Nonperforming LHFS
are excluded from nonperforming loans as they are recorded at
either fair value or the lower of cost or fair value. Nonperforming
loans do not include past due consumer credit card loans and in
general, past due consumer loans not secured by real estate as
these loans are generally charged off no later than the end of the
month in which the loan becomes 180 days past due. The fully-
insured loan portfolio is not reported as nonperforming as principal
repayment is insured. Additionally, nonperforming loans do not
include the Countrywide PCI loan portfolio or loans that we account
for under the fair value option. For further information on
nonperforming loans, see Note 1 – Summary of Significant
Accounting Principles to the Consolidated Financial Statements.
Nonperforming loans declined to $18.8 billion at December 31,
2011 compared to $20.9 billion at December 31, 2010.
Delinquency inflows to nonperforming loans slowed compared to
the prior year due to favorable portfolio trends and were more than
offset by charge-offs, nonperforming loans returning to performing
status, and paydowns and payoffs.
The outstanding balance of a real estate-secured loan that is
in excess of the estimated property value, after reducing the
estimated property value for estimated costs to sell, is charged
off no later than the end of the month in which the loan becomes
180 days past due unless repayment of the loan is fully insured.
At December 31, 2011, $14.6 billion, or 71 percent, of
nonperforming consumer real estate loans and foreclosed
properties had been written down to their estimated property value
less estimated costs to sell, including $12.6 billion of
nonperforming loans 180 days or more past due and $2.0 billion
of foreclosed properties.
Foreclosed properties increased $742 million in 2011 as
additions outpaced liquidations. PCI loans are excluded from
nonperforming loans as these loans were written down to fair value
at the acquisition date. However, once the underlying real estate
is acquired by the Corporation upon foreclosure of the delinquent
PCI loan, it is included in foreclosed properties. Net changes to
foreclosed properties related to PCI loans increased $411 million
in 2011. Not included in foreclosed properties at December 31,
2011 was $1.4 billion of real estate that was acquired upon
foreclosure of delinquent FHA-insured loans. We hold this real
estate on our balance sheet until we convey these properties to
the FHA. We exclude these amounts from our nonperforming loans
and foreclosed properties activity as we will be reimbursed once
the property is conveyed to the FHA for principal and, up to certain
limits, costs incurred during the foreclosure process and interest
incurred during the holding period. For additional information on
the review of our foreclosure processes, see Off-Balance Sheet
Arrangements and Contractual Obligations – Other Mortgage-
related Matters on page 57.
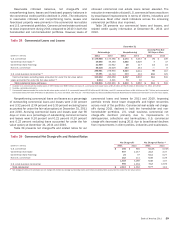
Restructured Loans
Nonperforming loans also include certain loans that have been
modified in TDRs where economic concessions have been granted
to borrowers experiencing financial difficulties. These concessions
typically result from the Corporation’s loss mitigation activities and
could include reductions in the interest rate, payment extensions,
forgiveness of principal, forbearance or other actions. Certain
TDRs are classified as nonperforming at the time of restructuring
and may only be returned to performing status after considering
the borrower’s sustained repayment performance under revised
payment terms for a reasonable period, generally six months.
Nonperforming TDRs, excluding those modified loans in the
Countrywide PCI loan portfolio, are included in Table 36.
As a result of accounting guidance on PCI loans, beginning
January 1, 2010, modifications of loans in the PCI loan portfolio
do not result in removal of the loan from the PCI loan pool. TDRs
in the consumer real estate portfolio that were removed from the