Bank of America 2011 Annual Report Download - page 102
Download and view the complete annual report
Please find page 102 of the 2011 Bank of America annual report below. You can navigate through the pages in the report by either clicking on the pages listed below, or by using the keyword search tool below to find specific information within the annual report.-
 1
1 -
2
-
3
-
4
-
5
-
6
-
7
-
8
-
9
-
10
-
11
-
12
-
13
-
14
-
15
-
16
-
17
-
18
-
19
-
20
-
21
-
22
-
23
-
24
-
25
-
26
-
27
-
28
-
29
-
30
-
31
-
32
-
33
-
34
-
35
-
36
-
37
-
38
-
39
-
40
-
41
-
42
-
43
-
44
-
45
-
46
-
47
-
48
-
49
-
50
-
51
-
52
-
53
-
54
-
55
-
56
-
57
-
58
-
59
-
60
-
61
-
62
-
63
-
64
-
65
-
66
-
67
-
68
-
69
-
70
-
71
-
72
-
73
-
74
-
75
-
76
-
77
-
78
-
79
-
80
-
81
-
82
-
83
-
84
-
85
-
86
-
87
-
88
-
89
-
90
-
91
-
 92
92 -
 93
93 -
 94
94 -
 95
95 -
 96
96 -
 97
97 -
 98
98 -
 99
99 -
 100
100 -
 101
101 -
 102
102 -
 103
103 -
 104
104 -
 105
105 -
 106
106 -
 107
107 -
 108
108 -
 109
109 -
 110
110 -
 111
111 -
 112
112 -
113
-
114
-
115
-
116
-
117
-
118
-
119
-
120
-
121
-
122
-
123
-
124
-
125
-
126
-
127
-
128
-
129
-
130
-
131
-
132
-
133
-
134
-
135
-
136
-
137
-
138
-
139
-
140
-
141
-
142
-
143
-
144
-
145
-
146
-
147
-
148
-
149
-
150
-
151
-
152
-
153
-
154
-
155
-
156
-
157
-
158
-
159
-
160
-
161
-
162
-
163
-
164
-
165
-
166
-
167
-
168
-
169
-
170
-
171
-
172
-
173
-
174
-
175
-
176
-
177
-
178
-
179
-
180
-
181
-
182
-
183
-
184
-
185
-
186
-
187
-
188
-
189
-
190
-
191
-
192
-
193
-
194
-
195
-
196
-
197
-
198
-
199
-
200
-
201
-
202
-
203
-
204
-
205
-
206
-
207
-
208
-
209
-
210
-
211
-
212
-
213
-
214
-
215
-
216
-
217
-
218
-
219
-
220
-
221
-
222
-
223
-
224
-
225
-
226
-
227
-
228
-
229
-
230
-
231
-
232
-
233
-
234
-
235
-
236
-
237
-
238
-
239
-
240
-
241
-
242
-
243
-
244
-
245
-
246
-
247
-
248
-
249
-
250
-
251
-
252
-
253
-
254
-
255
-
256
-
257
-
258
-
259
-
260
-
261
-
262
-
263
-
264
-
265
-
266
-
267
-
268
-
269
-
270
-
271
-
272
-
273
-
274
-
275
-
276
 |
 |

100 Bank of America 2011
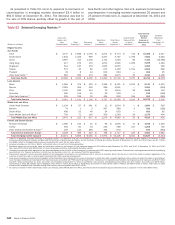
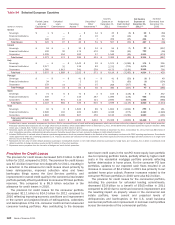
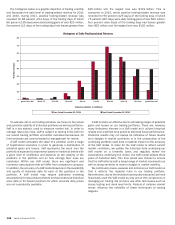
As presented in Table 53, non-U.S. exposure to borrowers or
counterparties in emerging markets decreased $3.4 billion to
$61.6 billion at December 31, 2011. The decrease was due to
the sale of CCB shares, partially offset by growth in the rest of
Asia Pacific and other regions. Non-U.S. exposure to borrowers or
counterparties in emerging markets represented 26 percent and
25 percent of total non-U.S. exposure at December 31, 2011 and
2010.
Table 53
(Dollars in millions)
Region/Country
Asia Pacific
India
South Korea
China
Hong Kong
Singapore
Taiwan
Thailand
Other Asia Pacific (7)
Total Asia Pacific
Latin America
Brazil
Mexico
Chile
Colombia
Other Latin America (7)
Total Latin America
Middle East and Africa
United Arab Emirates
Bahrain
South Africa
Other Middle East and Africa (7)
Total Middle East and Africa
Central and Eastern Europe
Russian Federation
Turkey
Other Central and Eastern Europe (7)
Total Central and Eastern Europe
Total emerging market exposure
Selected Emerging Markets (1)
Loans and
Leases, and
Loan
Commitments
$ 4,737
1,642
3,907
417
514
573
29
663
$ 12,482
$ 1,965
2,381
1,100
360
255
$ 6,061
$ 1,134
79
498
759
$ 2,470
$ 1,596
553
109
$ 2,258
$ 23,271
Other
Financing (2)
$ 1,686
1,228
315
276
130
35
8
356
$ 4,034
$ 374
305
180
114
218
$ 1,191
$87
1
53
71
$ 212
$ 145
81
143
$ 369
$ 5,806
Derivative
Assets (3)
$ 1,078
690
1,276
179
479
80
44
174
$ 4,000
$ 436
309
314
15
32
$ 1,106
$ 461
2
48
116
$ 627
$22
10
290
$ 322
$ 6,055
Securities/
Other
Investments (4)
$ 2,272
2,207
1,751
1,074
1,932
672
613
682
$ 11,203
$ 3,346
996
22
29
334
$ 4,727
$12
907
54
303
$ 1,276
$96
344
328
$ 768
$ 17,974
Total Cross-
border
Exposure (5)
$ 9,773
5,767
7,249
1,946
3,055
1,360
694
1,875
$ 31,719
$ 6,121
3,991
1,616
518
839
$ 13,085
$ 1,694
989
653
1,249
$ 4,585
$ 1,859
988
870
$ 3,717
$ 53,106
Local Country
Exposure Net
of Local
Liabilities (6)
$ 712
1,795
83
1,259
—
1,191
—
35
$ 5,075
$ 3,010
—
29
—
154
$ 3,193
$—
3
—
26
$29
$17
217
—
$ 234
$ 8,531
Total Selected
Emerging
Market
Exposure at
December 31,
2011(
$10,485
7,562
7,332
3,205
3,055
2,551
694
1,910
$36,794
$ 9,131
3,991
1,645
518
993
$16,278
$ 1,694
992
653
1,275
$ 4,614
$ 1,876
1,205
870
$ 3,951
$61,637
Increase
(Decrease)
From
December 31,
2010
$ 2,217
2,283
(16,596)
1,163
509
696
25
1,196
$ (8,507)
$ 3,325
(394)
119
(159)
(385)
$ 2,506
$ 518
(168)
82
494
$ 926
$ 1,340
705
(383)
$ 1,662
$ (3,413)
(1) There is no generally accepted definition of emerging markets. The definition that we use includes all countries in Asia Pacific excluding Japan, Australia and New Zealand; all countries in Latin
America excluding Cayman Islands and Bermuda; all countries in Middle East and Africa; and all countries in Central and Eastern Europe. At December 31, 2011 and 2010, there was $1.7 billion
and $460 million in emerging market exposure accounted for under the fair value option.
(2) Includes acceptances, due froms, SBLCs, commercial letters of credit and formal guarantees.
(3) Derivative assets are carried at fair value and have been reduced by the amount of cash collateral applied of $1.2 billion at both December 31, 2011 and 2010. At December 31, 2011 and 2010,
there were $353 million and $408 million of other marketable securities collateralizing derivative assets.
(4) Generally, cross-border resale agreements are presented based on the domicile of the counterparty, consistent with FFIEC reporting requirements. Cross-border resale agreements where the underlying
securities are U.S. Treasury securities, in which case the domicile is the U.S., are excluded from this presentation.
(5) Cross-border exposure includes amounts payable to the Corporation by borrowers or counterparties with a country of residence other than the one in which the credit is booked, regardless of the
currency in which the claim is denominated, consistent with FFIEC reporting requirements.
(6) Local country exposure includes amounts payable to the Corporation by borrowers with a country of residence in which the credit is booked regardless of the currency in which the claim is denominated.
Local funding or liabilities are subtracted from local exposures consistent with FFIEC reporting requirements. Total amount of available local liabilities funding local country exposure was $18.7 billion
and $15.7 billion at December 31, 2011 and 2010. Local liabilities at December 31, 2011 in Asia Pacific, Latin America, and Middle East and Africa were $17.3 billion, $1.0 billion and $278 million,
respectively, of which $9.2 billion was in Singapore, $2.3 billion in China, $2.2 billion in Hong Kong, $1.3 billion in India, $973 million in Mexico and $804 million in Korea. There were no other
countries with available local liabilities funding local country exposure greater than $500 million.
(7) No country included in Other Asia Pacific, Other Latin America, Other Middle East and Africa, and Other Central and Eastern Europe had total non-U.S. exposure of more than $500 million.