Bank of America 2011 Annual Report Download - page 119
Download and view the complete annual report
Please find page 119 of the 2011 Bank of America annual report below. You can navigate through the pages in the report by either clicking on the pages listed below, or by using the keyword search tool below to find specific information within the annual report.-
 1
1 -
2
-
3
-
4
-
5
-
6
-
7
-
8
-
9
-
10
-
11
-
12
-
13
-
14
-
15
-
16
-
17
-
18
-
19
-
20
-
21
-
22
-
23
-
24
-
25
-
26
-
27
-
28
-
29
-
30
-
31
-
32
-
33
-
34
-
35
-
36
-
37
-
38
-
39
-
40
-
41
-
42
-
43
-
44
-
45
-
46
-
47
-
48
-
49
-
50
-
51
-
52
-
53
-
54
-
55
-
56
-
57
-
58
-
59
-
60
-
61
-
62
-
63
-
64
-
65
-
66
-
67
-
68
-
69
-
70
-
71
-
72
-
73
-
74
-
75
-
76
-
77
-
78
-
79
-
80
-
81
-
82
-
83
-
84
-
85
-
86
-
87
-
88
-
89
-
90
-
91
-
92
-
93
-
94
-
95
-
96
-
97
-
98
-
99
-
100
-
101
-
102
-
103
-
104
-
105
-
106
-
107
-
108
-
 109
109 -
 110
110 -
 111
111 -
 112
112 -
 113
113 -
 114
114 -
 115
115 -
 116
116 -
 117
117 -
 118
118 -
 119
119 -
 120
120 -
 121
121 -
 122
122 -
 123
123 -
 124
124 -
 125
125 -
 126
126 -
 127
127 -
 128
128 -
 129
129 -
130
-
131
-
132
-
133
-
134
-
135
-
136
-
137
-
138
-
139
-
140
-
141
-
142
-
143
-
144
-
145
-
146
-
147
-
148
-
149
-
150
-
151
-
152
-
153
-
154
-
155
-
156
-
157
-
158
-
159
-
160
-
161
-
162
-
163
-
164
-
165
-
166
-
167
-
168
-
169
-
170
-
171
-
172
-
173
-
174
-
175
-
176
-
177
-
178
-
179
-
180
-
181
-
182
-
183
-
184
-
185
-
186
-
187
-
188
-
189
-
190
-
191
-
192
-
193
-
194
-
195
-
196
-
197
-
198
-
199
-
200
-
201
-
202
-
203
-
204
-
205
-
206
-
207
-
208
-
209
-
210
-
211
-
212
-
213
-
214
-
215
-
216
-
217
-
218
-
219
-
220
-
221
-
222
-
223
-
224
-
225
-
226
-
227
-
228
-
229
-
230
-
231
-
232
-
233
-
234
-
235
-
236
-
237
-
238
-
239
-
240
-
241
-
242
-
243
-
244
-
245
-
246
-
247
-
248
-
249
-
250
-
251
-
252
-
253
-
254
-
255
-
256
-
257
-
258
-
259
-
260
-
261
-
262
-
263
-
264
-
265
-
266
-
267
-
268
-
269
-
270
-
271
-
272
-
273
-
274
-
275
-
276
 |
 |

Bank of America 2011 117
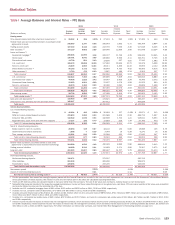
Table 61
(Dollars in millions)
Trading account assets
Derivative assets
AFS securities
All other Level 3 assets at fair value
Total Level 3 assets at fair value (1)
Derivative liabilities
Long-term debt
All other Level 3 liabilities at fair value
Total Level 3 liabilities at fair value (1)
Level 3 Asset and Liability Summary
December 31, 2011
Level 3
Fair Value
$ 11,455
14,366
8,012
17,744
$ 51,577
Level 3
Fair Value
$ 8,500
2,943
128
$ 11,571
As a %
of Total
Level 3
Assets
22.21%
27.85
15.53
34.41
100.00%
As a %
of Total
Level 3
Liabilities
73.46%
25.43
1.11
100.00%
As a %
of Total
Assets
0.54%
0.67
0.38
0.83
2.42%
As a %
of Total
Liabilities
0.45%
0.15
0.01
0.61%
December 31, 2010
Level 3
Fair Value
$ 15,525
18,773
15,873
29,217
$ 79,388
Level 3
Fair Value
$ 11,028
2,986
1,541
$ 15,555
As a %
of Total
Level 3
Assets
19.56%
23.65
19.99
36.80
100.00%
As a %
of Total
Level 3
Liabilities
70.90%
19.20
9.90
100.00%
As a %
of Total
Assets
0.69%
0.83
0.70
1.29
3.51%
As a %
of Total
Liabilities
0.54%
0.15
0.07
0.76%
(1) Level 3 total assets and liabilities are shown before the impact of counterparty netting related to our derivative positions.
During 2011, we recognized net gains of $451 million on Level
3 assets and liabilities. The net gains during the year were primarily
in trading account profits combined with gains on IRLCs, partially
offset by losses on MSRs. There were net unrealized gains of $19
million in accumulated OCI on Level 3 assets and liabilities at
December 31, 2011.
Level 3 financial instruments, such as our consumer MSRs,
may be economically hedged with derivatives classified as Level
1 or 2; therefore, gains or losses associated with Level 3 financial
instruments may be offset by gains or losses associated with
financial instruments classified in other levels of the fair value
hierarchy. The Level 3 gains and losses recorded in earnings did
not have a significant impact on our liquidity or capital resources.
We conduct a review of our fair value hierarchy classifications
on a quarterly basis. Transfers into or out of Level 3 are made if
the significant inputs used in the financial models measuring the
fair values of the assets and liabilities became unobservable or
observable, respectively, in the current marketplace. These
transfers are considered to be effective as of the beginning of the
quarter in which they occur. For additional information on the
significant transfers into and out of Level 3 during 2011, see Note
22 – Fair Value Measurements to the Consolidated Financial
Statements.
Global Principal Investments
GPI is included within Equity Investments in All Other on page 48.
GPI is comprised of a diversified portfolio of private equity, real
estate and other alternative investments in both privately-held and
publicly-traded companies. These investments are made either
directly in a company or held through a fund. At December 31,
2011, this portfolio totaled $5.6 billion including $4.3 billion of
non-public investments.
Certain equity investments in the portfolio are subject to
investment company accounting under applicable accounting
guidance, and accordingly, are carried at fair value with changes
in fair value reported in equity investment income. Initially the
transaction price of the investment is generally considered to be
the best indicator of fair value. Thereafter, valuation of direct
investments is based on an assessment of each individual
investment using methodologies that include publicly-traded
comparables derived by multiplying a key performance metric (e.g.,
earnings before interest, taxes, depreciation and amortization) of
the portfolio company by the relevant valuation multiple observed
for comparable companies, acquisition comparables, entry-level
multiples and discounted cash flows, and are subject to
appropriate discounts for lack of liquidity or marketability. Certain
factors that may influence changes in fair value include but are
not limited to, recapitalizations, subsequent rounds of financing
and offerings in the equity or debt capital markets. For fund
investments, we generally record the fair value of our proportionate
interest in the fund’s capital as reported by the fund’s respective
managers.
Accrued Income Taxes and Deferred Tax Assets
Accrued income taxes, reported as a component of accrued
expenses and other liabilities on our Consolidated Balance Sheet,
represent the net amount of current income taxes we expect to
pay to or receive from various taxing jurisdictions attributable to
our operations to date. We currently file income tax returns in more
than 100 jurisdictions and consider many factors, including
statutory, judicial and regulatory guidance, in estimating the
appropriate accrued income taxes for each jurisdiction.
In applying the applicable accounting guidance, we monitor
relevant tax authorities and change our estimate of accrued
income taxes due to changes in income tax laws and their
interpretation by the courts and regulatory authorities. These
revisions of our estimate of accrued income taxes, which also may
result from our income tax planning and from the resolution of
income tax controversies, may be material to our operating results
for any given period.