Bank of America 2011 Annual Report Download - page 187
Download and view the complete annual report
Please find page 187 of the 2011 Bank of America annual report below. You can navigate through the pages in the report by either clicking on the pages listed below, or by using the keyword search tool below to find specific information within the annual report.-
 1
1 -
2
-
3
-
4
-
5
-
6
-
7
-
8
-
9
-
10
-
11
-
12
-
13
-
14
-
15
-
16
-
17
-
18
-
19
-
20
-
21
-
22
-
23
-
24
-
25
-
26
-
27
-
28
-
29
-
30
-
31
-
32
-
33
-
34
-
35
-
36
-
37
-
38
-
39
-
40
-
41
-
42
-
43
-
44
-
45
-
46
-
47
-
48
-
49
-
50
-
51
-
52
-
53
-
54
-
55
-
56
-
57
-
58
-
59
-
60
-
61
-
62
-
63
-
64
-
65
-
66
-
67
-
68
-
69
-
70
-
71
-
72
-
73
-
74
-
75
-
76
-
77
-
78
-
79
-
80
-
81
-
82
-
83
-
84
-
85
-
86
-
87
-
88
-
89
-
90
-
91
-
92
-
93
-
94
-
95
-
96
-
97
-
98
-
99
-
100
-
101
-
102
-
103
-
104
-
105
-
106
-
107
-
108
-
109
-
110
-
111
-
112
-
113
-
114
-
115
-
116
-
117
-
118
-
119
-
120
-
121
-
122
-
123
-
124
-
125
-
126
-
127
-
128
-
129
-
130
-
131
-
132
-
133
-
134
-
135
-
136
-
137
-
138
-
139
-
140
-
141
-
142
-
143
-
144
-
145
-
146
-
147
-
148
-
149
-
150
-
151
-
152
-
153
-
154
-
155
-
156
-
157
-
158
-
159
-
160
-
161
-
162
-
163
-
164
-
165
-
166
-
167
-
168
-
169
-
170
-
171
-
172
-
173
-
174
-
175
-
176
-
 177
177 -
 178
178 -
 179
179 -
 180
180 -
 181
181 -
 182
182 -
 183
183 -
 184
184 -
 185
185 -
 186
186 -
 187
187 -
 188
188 -
 189
189 -
 190
190 -
 191
191 -
 192
192 -
 193
193 -
 194
194 -
 195
195 -
 196
196 -
 197
197 -
198
-
199
-
200
-
201
-
202
-
203
-
204
-
205
-
206
-
207
-
208
-
209
-
210
-
211
-
212
-
213
-
214
-
215
-
216
-
217
-
218
-
219
-
220
-
221
-
222
-
223
-
224
-
225
-
226
-
227
-
228
-
229
-
230
-
231
-
232
-
233
-
234
-
235
-
236
-
237
-
238
-
239
-
240
-
241
-
242
-
243
-
244
-
245
-
246
-
247
-
248
-
249
-
250
-
251
-
252
-
253
-
254
-
255
-
256
-
257
-
258
-
259
-
260
-
261
-
262
-
263
-
264
-
265
-
266
-
267
-
268
-
269
-
270
-
271
-
272
-
273
-
274
-
275
-
276
 |
 |

Bank of America 2011 185
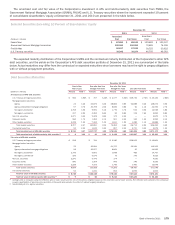
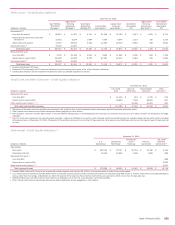
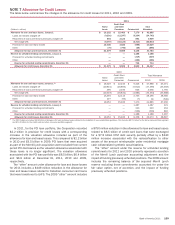
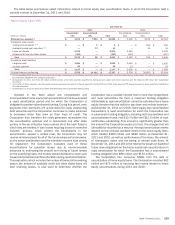
The table below provides information on the Corporation’s renegotiated TDR portfolio. At December 31, 2011 and 2010, the
renegotiated TDR portfolio was considered impaired and had a related allowance as shown in the table below.
Impaired Loans – Credit Card and Other Consumer – Renegotiated TDRs
(Dollars in millions)
With an allowance recorded
U.S. credit card
Non-U.S. credit card
Direct/Indirect consumer
With an allowance recorded
U.S. credit card
Non-U.S. credit card
Direct/Indirect consumer
December 31, 2011
Unpaid
Principal
Balance
$ 5,272
588
1,193
December 31, 2010
$ 8,680
778
1,846
Carrying
Value (1)
$ 5,305
597
1,198
$ 8,766
797
1,858
Related
Allowance
$ 1,570
435
405
$ 3,458
506
822
2011
Average
Carrying
Value
$ 7,211
759
1,582
2010
$ 10,549
973
2,126
Interest
Income
Recognized (2)
$ 433
6
85
$ 621
21
111
(1) Includes accrued interest and fees.
(2) Interest income recognized includes interest accrued and collected on the outstanding balances of accruing impaired loans as well as interest cash collections on nonaccruing impaired loans for
which the ultimate collectability of principal is not uncertain.
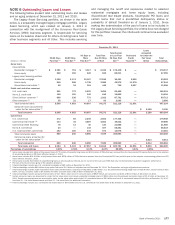
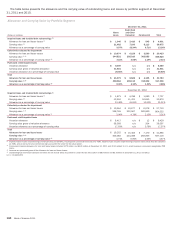
The table below provides information on the Corporation’s primary modification programs for the renegotiated TDR portfolio at
December 31, 2011 and 2010.
Credit Card and Other Consumer – Renegotiated TDR Portfolio by Program Type
(Dollars in millions)
U.S. credit card
Non-U.S. credit card
Direct/Indirect consumer
Total renegotiated TDR loans
Internal Programs
December 31
2011
$ 3,788
218
784
$ 4,790
2010
$ 6,592
282
1,222
$ 8,096
External Programs
December 31
2011
$ 1,436
113
392
$ 1,941
2010
$ 1,927
176
531
$ 2,634
Other (1)
December 31
2011
$81
266
22
$369
2010
$ 247
339
105
$ 691
Total
December 31
2011
$ 5,305
597
1,198
$ 7,100
2010
$ 8,766
797
1,858
$ 11,421
Percent of Balances Current or
Less Than 30 Days Past Due
December 31
2011
78.97%
54.02
80.01
77.05
2010
77.66%
58.86
78.81
76.51
(1) Other programs include ineligible U.K. credit card and other consumer loans.
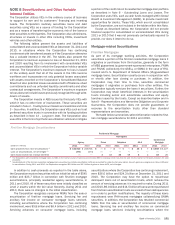
At December 31, 2011 and 2010, the Corporation had a
renegotiated TDR portfolio of $7.1 billion and $11.4 billion of which
$5.5 billion was current or less than 30 days past due under the
modified terms at December 31, 2011. The renegotiated TDR
portfolio is excluded from nonperforming loans as the Corporation
generally does not classify consumer loans not secured by real
estate as nonperforming. Instead, these loans are charged off no
later than the end of the month in which the loan becomes
180 days past due.
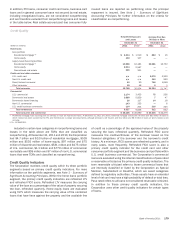
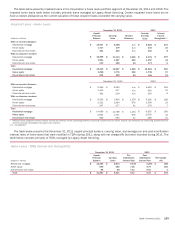
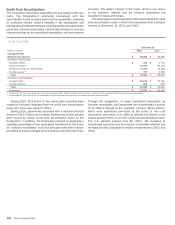
The table below provides information on the Corporation’s
renegotiated TDR portfolio including the unpaid principal balance
and carrying value of loans that were modified in TDRs during
2011, along with charge-offs that were recorded during 2011. The
table also presents the average pre- and post-modification interest
rate.
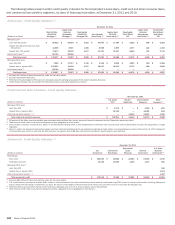
Credit Card and Other Consumer – Renegotiated TDRs Entered into During 2011
(Dollars in millions)
U.S. credit card
Non-U.S. credit card
Direct/Indirect consumer
Total
December 31, 2011
Unpaid
Principal
Balance
$890
305
198
$ 1,393
Carrying
Value (1)
$902
322
199
$ 1,423
2011
Pre-
modification
Interest Rate
19.04%
26.32
15.63
20.20
Post-
modification
Interest Rate
6.16%
1.04
5.22
4.87
Net Charge-
offs
$44
126
10
$ 180
(1) Includes accrued interest and fees.