Bank of America 2011 Annual Report Download - page 121
Download and view the complete annual report
Please find page 121 of the 2011 Bank of America annual report below. You can navigate through the pages in the report by either clicking on the pages listed below, or by using the keyword search tool below to find specific information within the annual report.-
 1
1 -
2
-
3
-
4
-
5
-
6
-
7
-
8
-
9
-
10
-
11
-
12
-
13
-
14
-
15
-
16
-
17
-
18
-
19
-
20
-
21
-
22
-
23
-
24
-
25
-
26
-
27
-
28
-
29
-
30
-
31
-
32
-
33
-
34
-
35
-
36
-
37
-
38
-
39
-
40
-
41
-
42
-
43
-
44
-
45
-
46
-
47
-
48
-
49
-
50
-
51
-
52
-
53
-
54
-
55
-
56
-
57
-
58
-
59
-
60
-
61
-
62
-
63
-
64
-
65
-
66
-
67
-
68
-
69
-
70
-
71
-
72
-
73
-
74
-
75
-
76
-
77
-
78
-
79
-
80
-
81
-
82
-
83
-
84
-
85
-
86
-
87
-
88
-
89
-
90
-
91
-
92
-
93
-
94
-
95
-
96
-
97
-
98
-
99
-
100
-
101
-
102
-
103
-
104
-
105
-
106
-
107
-
108
-
109
-
110
-
 111
111 -
 112
112 -
 113
113 -
 114
114 -
 115
115 -
 116
116 -
 117
117 -
 118
118 -
 119
119 -
 120
120 -
 121
121 -
 122
122 -
 123
123 -
 124
124 -
 125
125 -
 126
126 -
 127
127 -
 128
128 -
 129
129 -
 130
130 -
 131
131 -
132
-
133
-
134
-
135
-
136
-
137
-
138
-
139
-
140
-
141
-
142
-
143
-
144
-
145
-
146
-
147
-
148
-
149
-
150
-
151
-
152
-
153
-
154
-
155
-
156
-
157
-
158
-
159
-
160
-
161
-
162
-
163
-
164
-
165
-
166
-
167
-
168
-
169
-
170
-
171
-
172
-
173
-
174
-
175
-
176
-
177
-
178
-
179
-
180
-
181
-
182
-
183
-
184
-
185
-
186
-
187
-
188
-
189
-
190
-
191
-
192
-
193
-
194
-
195
-
196
-
197
-
198
-
199
-
200
-
201
-
202
-
203
-
204
-
205
-
206
-
207
-
208
-
209
-
210
-
211
-
212
-
213
-
214
-
215
-
216
-
217
-
218
-
219
-
220
-
221
-
222
-
223
-
224
-
225
-
226
-
227
-
228
-
229
-
230
-
231
-
232
-
233
-
234
-
235
-
236
-
237
-
238
-
239
-
240
-
241
-
242
-
243
-
244
-
245
-
246
-
247
-
248
-
249
-
250
-
251
-
252
-
253
-
254
-
255
-
256
-
257
-
258
-
259
-
260
-
261
-
262
-
263
-
264
-
265
-
266
-
267
-
268
-
269
-
270
-
271
-
272
-
273
-
274
-
275
-
276
 |
 |
Bank of America 2011 119
Consumer Real Estate Services
In connection with the sale of Balboa on June 1, 2011, we
allocated, on a relative fair value basis, $193 million of CRES
goodwill to the business in determining the gain on the sale.
During the three months ended June 30, 2011, as a
consequence of the BNY Mellon Settlement entered into by the
Corporation on June 28, 2011, the adverse impact of the
incremental mortgage-related charges and the continued
economic slowdown in the mortgage business, we performed a
goodwill impairment test for the CRES reporting unit. We concluded
that the remaining balance of goodwill of $2.6 billion was impaired,
and accordingly, recorded a non-cash, non-tax deductible goodwill
impairment charge to reduce the carrying value of the goodwill in
CRES to zero.
2011 Annual Impairment Test
During the three months ended September 30, 2011, we
completed our annual goodwill impairment test as of June 30,
2011 for all reporting units which had goodwill. In performing the
first step of the annual goodwill impairment analysis, we compared
the fair value of each reporting unit to its current carrying value,
including goodwill. To determine fair value, we utilized a
combination of the market approach and income approach. Under
the market approach, we compared earnings and equity multiples
of the individual reporting units to multiples of public companies
comparable to the individual reporting units. The control premiums
used in the June 30, 2011 annual goodwill impairment test ranged
from 25 percent to 35 percent. Under the income approach, we
updated our assumptions to reflect the current market
environment. The discount rates used in the June 30, 2011 annual
goodwill impairment test ranged from 11 percent to 16 percent
depending on the relative risk of a reporting unit. Growth rates
developed by management for individual revenue and expense
items in each reporting unit ranged from 0.7 percent to 6.7 percent.
For certain revenue and expense items that have been significantly
affected by the current economic environment and financial reform,
management developed separate long-term forecasts.
Based on the results of step one of the annual goodwill
impairment test, we determined that step two was not required
for any of the reporting units as their fair value exceeded their
carrying value indicating there was no impairment.
2010 Impairment Tests
During the three months ended September 30, 2010, we
performed a goodwill impairment test for Card Services due to the
continued stress on the business and the uncertain debit card
interchange provisions under the Financial Reform Act. We
concluded that goodwill was impaired, and accordingly, recorded
a non-cash, non-tax deductible goodwill impairment charge of
$10.4 billion to reduce the carrying value of the goodwill in Card
Services.
During the three months ended December 31, 2010, we
performed a goodwill impairment test for the CRES reporting unit
as it was likely that there was a decline in its fair value as a result
of increased uncertainties, including existing and potential
litigation exposure and other related risks, higher servicing costs
including those related to loss mitigation, foreclosure related
issues and the redeployment of centralized sales resources. We
concluded that goodwill was impaired, and accordingly, recorded
a non-cash, non-tax deductible goodwill impairment charge of $2.0
billion in CRES.
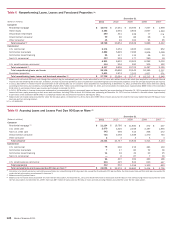
Representations and Warranties
The methodology used to estimate the liability for obligations under
representations and warranties related to transfers of residential
mortgage loans is a function of the representations and warranties
given and considers a variety of factors. Depending upon the
counterparty, these factors include actual defaults, estimated
future defaults, historical loss experience, estimated home prices,
other economic conditions, estimated probability that we will
receive a repurchase request, including consideration of whether
presentation thresholds will be met, number of payments made
by the borrower prior to default, estimated probability that we will
be required to repurchase a loan and the experience with and the
behavior of the counterparty. It also considers bulk settlements,
as appropriate. The estimate of the liability for obligations under
representations and warranties is based upon currently available
information, significant judgment, and a number of factors,
including those set forth above, that are subject to change.
Changes to any one of these factors could significantly impact the
estimate of our liability.
The provision for representations and warranties may vary
significantly each period as the methodology used to estimate the
expense continues to be refined based on the level and type of
repurchase requests presented, defects identified, the latest
experience gained on repurchase requests and other relevant facts
and circumstances. The estimated range of possible loss related
to non-GSE representations and warranties exposure has been
disclosed. For the GSE claims where we have established a
representations and warranties liability as discussed in Note 9 –
Representations and Warranties Obligations and Corporate
Guarantees to the Consolidated Financial Statements, an
assumed simultaneous increase or decrease of 10 percent in
estimated future defaults, loss severity and the net repurchase
rate would result in an increase of approximately $850 million or
decrease of approximately $800 million in the representations
and warranties liability as of December 31, 2011. Viewed from
the perspective of home prices, for each one percent change in
home prices, the liability for representations and warranties on
unsettled GSE originations is estimated to be impacted by $125
million based on projected collateral losses and defect rates.
These sensitivities are hypothetical and are intended to provide
an indication of the impact of a significant change in these key
assumptions on the representations and warranties liability. In
reality, changes in one assumption may result in changes in other
assumptions, which may or may not counteract the sensitivity.