Bank of America 2011 Annual Report Download - page 258
Download and view the complete annual report
Please find page 258 of the 2011 Bank of America annual report below. You can navigate through the pages in the report by either clicking on the pages listed below, or by using the keyword search tool below to find specific information within the annual report.-
 1
1 -
2
-
3
-
4
-
5
-
6
-
7
-
8
-
9
-
10
-
11
-
12
-
13
-
14
-
15
-
16
-
17
-
18
-
19
-
20
-
21
-
22
-
23
-
24
-
25
-
26
-
27
-
28
-
29
-
30
-
31
-
32
-
33
-
34
-
35
-
36
-
37
-
38
-
39
-
40
-
41
-
42
-
43
-
44
-
45
-
46
-
47
-
48
-
49
-
50
-
51
-
52
-
53
-
54
-
55
-
56
-
57
-
58
-
59
-
60
-
61
-
62
-
63
-
64
-
65
-
66
-
67
-
68
-
69
-
70
-
71
-
72
-
73
-
74
-
75
-
76
-
77
-
78
-
79
-
80
-
81
-
82
-
83
-
84
-
85
-
86
-
87
-
88
-
89
-
90
-
91
-
92
-
93
-
94
-
95
-
96
-
97
-
98
-
99
-
100
-
101
-
102
-
103
-
104
-
105
-
106
-
107
-
108
-
109
-
110
-
111
-
112
-
113
-
114
-
115
-
116
-
117
-
118
-
119
-
120
-
121
-
122
-
123
-
124
-
125
-
126
-
127
-
128
-
129
-
130
-
131
-
132
-
133
-
134
-
135
-
136
-
137
-
138
-
139
-
140
-
141
-
142
-
143
-
144
-
145
-
146
-
147
-
148
-
149
-
150
-
151
-
152
-
153
-
154
-
155
-
156
-
157
-
158
-
159
-
160
-
161
-
162
-
163
-
164
-
165
-
166
-
167
-
168
-
169
-
170
-
171
-
172
-
173
-
174
-
175
-
176
-
177
-
178
-
179
-
180
-
181
-
182
-
183
-
184
-
185
-
186
-
187
-
188
-
189
-
190
-
191
-
192
-
193
-
194
-
195
-
196
-
197
-
198
-
199
-
200
-
201
-
202
-
203
-
204
-
205
-
206
-
207
-
208
-
209
-
210
-
211
-
212
-
213
-
214
-
215
-
216
-
217
-
218
-
219
-
220
-
221
-
222
-
223
-
224
-
225
-
226
-
227
-
228
-
229
-
230
-
231
-
232
-
233
-
234
-
235
-
236
-
237
-
238
-
239
-
240
-
241
-
242
-
243
-
244
-
245
-
246
-
247
-
 248
248 -
 249
249 -
 250
250 -
 251
251 -
 252
252 -
 253
253 -
 254
254 -
 255
255 -
 256
256 -
 257
257 -
 258
258 -
 259
259 -
 260
260 -
 261
261 -
 262
262 -
 263
263 -
 264
264 -
 265
265 -
 266
266 -
 267
267 -
 268
268 -
269
-
270
-
271
-
272
-
273
-
274
-
275
-
276
 |
 |

256 Bank of America 2011
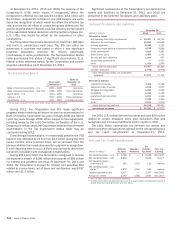
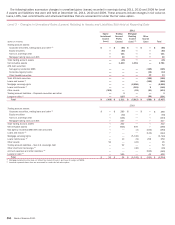
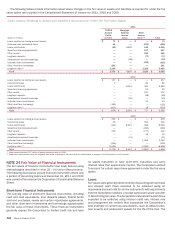
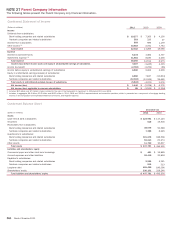
The following tables summarize changes in unrealized gains (losses) recorded in earnings during 2011, 2010 and 2009 for Level
3 assets and liabilities that were still held at December 31, 2011, 2010 and 2009. These amounts include changes in fair value on
loans, LHFS, loan commitments and structured liabilities that are accounted for under the fair value option.
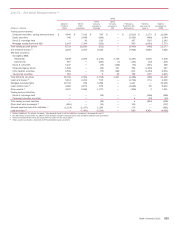
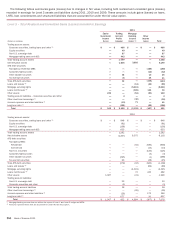
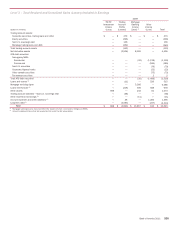
Level 3 – Changes in Unrealized Gains (Losses) Relating to Assets and Liabilities Still Held at Reporting Date
(Dollars in millions)
Trading account assets:
Corporate securities, trading loans and other (2)
Equity securities
Non-U.S. sovereign debt
Mortgage trading loans and ABS
Total trading account assets
Net derivative assets
AFS debt securities:
Non-agency residential MBS
Corporate/Agency bonds
Other taxable securities
Total AFS debt securities
Loans and leases (2)
Mortgage servicing rights
Loans held-for-sale (2)
Other assets
Trading account liabilities – Corporate securities and other
Long-term debt (2)
Total
Trading account assets:
Corporate securities, trading loans and other (2)
Equity securities
Non-U.S. sovereign debt
Mortgage trading loans and ABS
Total trading account assets
Net derivative assets
Non-agency residential MBS AFS debt securities
Loans and leases (2)
Mortgage servicing rights
Loans held-for-sale (2)
Other assets
Trading account liabilities – Non-U.S. sovereign debt
Other short-term borrowings (2)
Accrued expenses and other liabilities (2)
Long-term debt (2)
Total
2011
Equity
Investment
Income
(Loss)
$—
—
—
—
—
—
—
—
—
—
—
—
—
(309)
—
—
$ (309)
2010
$—
—
—
—
—
—
—
—
—
—
50
—
—
—
—
$50
Trading
Account
Profits
(Losses)
$ (86)
(60)
101
30
(15)
1,430
—
—
—
—
—
—
—
—
3
(107)
$ 1,311
$ 289
(50)
(144)
227
322
(945)
—
—
—
10
—
52
—
—
585
$24
Mortgage
Banking
Income
(Loss) (1)
$—
—
—
—
—
1,351
—
—
—
—
—
(6,958)
(153)
(53)
—
—
$(5,813)
$—
—
—
—
—
676
(2)
—
(5,740)
(9)
(22)
—
(46)
—
—
$ (5,143)
Other
Income
(Loss)
$—
—
—
—
—
—
(195)
(14)
13
(196)
(260)
—
5
(51)
—
(94)
$(596)
$—
—
—
—
—
—
(162)
(142)
—
258
—
—
—
(182)
43
$ (185)
Total
$ (86)
(60)
101
30
(15)
2,781
(195)
(14)
13
(196)
(260)
(6,958)
(148)
(413)
3
(201)
$ (5,407)
$ 289
(50)
(144)
227
322
(269)
(164)
(142)
(5,740)
259
28
52
(46)
(182)
628
$ (5,254)
(1) Mortgage banking income does not reflect the impact of Level 1 and Level 2 hedges on MSRs.
(2) Amounts represent items that are accounted for under the fair value option.