Bank of America 2011 Annual Report Download - page 109
Download and view the complete annual report
Please find page 109 of the 2011 Bank of America annual report below. You can navigate through the pages in the report by either clicking on the pages listed below, or by using the keyword search tool below to find specific information within the annual report.-
 1
1 -
2
-
3
-
4
-
5
-
6
-
7
-
8
-
9
-
10
-
11
-
12
-
13
-
14
-
15
-
16
-
17
-
18
-
19
-
20
-
21
-
22
-
23
-
24
-
25
-
26
-
27
-
28
-
29
-
30
-
31
-
32
-
33
-
34
-
35
-
36
-
37
-
38
-
39
-
40
-
41
-
42
-
43
-
44
-
45
-
46
-
47
-
48
-
49
-
50
-
51
-
52
-
53
-
54
-
55
-
56
-
57
-
58
-
59
-
60
-
61
-
62
-
63
-
64
-
65
-
66
-
67
-
68
-
69
-
70
-
71
-
72
-
73
-
74
-
75
-
76
-
77
-
78
-
79
-
80
-
81
-
82
-
83
-
84
-
85
-
86
-
87
-
88
-
89
-
90
-
91
-
92
-
93
-
94
-
95
-
96
-
97
-
98
-
 99
99 -
 100
100 -
 101
101 -
 102
102 -
 103
103 -
 104
104 -
 105
105 -
 106
106 -
 107
107 -
 108
108 -
 109
109 -
 110
110 -
 111
111 -
 112
112 -
 113
113 -
 114
114 -
 115
115 -
 116
116 -
 117
117 -
 118
118 -
 119
119 -
120
-
121
-
122
-
123
-
124
-
125
-
126
-
127
-
128
-
129
-
130
-
131
-
132
-
133
-
134
-
135
-
136
-
137
-
138
-
139
-
140
-
141
-
142
-
143
-
144
-
145
-
146
-
147
-
148
-
149
-
150
-
151
-
152
-
153
-
154
-
155
-
156
-
157
-
158
-
159
-
160
-
161
-
162
-
163
-
164
-
165
-
166
-
167
-
168
-
169
-
170
-
171
-
172
-
173
-
174
-
175
-
176
-
177
-
178
-
179
-
180
-
181
-
182
-
183
-
184
-
185
-
186
-
187
-
188
-
189
-
190
-
191
-
192
-
193
-
194
-
195
-
196
-
197
-
198
-
199
-
200
-
201
-
202
-
203
-
204
-
205
-
206
-
207
-
208
-
209
-
210
-
211
-
212
-
213
-
214
-
215
-
216
-
217
-
218
-
219
-
220
-
221
-
222
-
223
-
224
-
225
-
226
-
227
-
228
-
229
-
230
-
231
-
232
-
233
-
234
-
235
-
236
-
237
-
238
-
239
-
240
-
241
-
242
-
243
-
244
-
245
-
246
-
247
-
248
-
249
-
250
-
251
-
252
-
253
-
254
-
255
-
256
-
257
-
258
-
259
-
260
-
261
-
262
-
263
-
264
-
265
-
266
-
267
-
268
-
269
-
270
-
271
-
272
-
273
-
274
-
275
-
276
 |
 |
Bank of America 2011 107
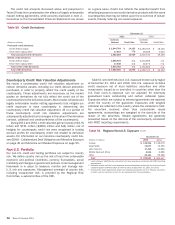
Commodity Risk
Commodity risk represents exposures to instruments traded in
the petroleum, natural gas, power and metals markets. These
instruments consist primarily of futures, forwards, swaps and
options. Hedging instruments used to mitigate this risk include
options, futures and swaps in the same or similar commodity
product, as well as cash positions.
Issuer Credit Risk
Issuer credit risk represents exposures to changes in the
creditworthiness of individual issuers or groups of issuers. Our
portfolio is exposed to issuer credit risk where the value of an
asset may be adversely impacted by changes in the levels of credit
spreads, by credit migration or by defaults. Hedging instruments
used to mitigate this risk include bonds, CDS and other credit
fixed-income instruments.
Market Liquidity Risk
Market liquidity risk represents the risk that the level of expected
market activity changes dramatically and, in certain cases, may
even cease. This exposes us to the risk that we will not be able
to transact business and execute trades in an orderly manner
which may impact our results. This impact could further be
exacerbated if expected hedging or pricing correlations are
compromised by disproportionate demand or lack of demand for
certain instruments. We utilize various risk mitigating techniques
as discussed in more detail in Trading Risk Management.
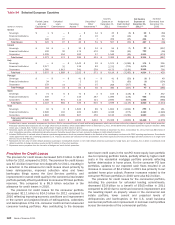
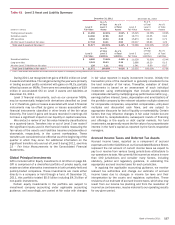
Trading Risk Management
Trading-related revenues represent the amount earned from
trading positions, including market-based net interest income,
which are taken in a diverse range of financial instruments and
markets. Trading account assets and liabilities and derivative
positions are reported at fair value. For more information on fair
value, see Note 22 – Fair Value Measurements to the Consolidated
Financial Statements. Trading-related revenues can be volatile and
are largely driven by general market conditions and customer
demand. Also, trading-related revenues are dependent on the
volume and type of transactions, the level of risk assumed, and
the volatility of price and rate movements at any given time within
the ever-changing market environment.
The Global Markets Risk Committee (GRC), chaired by the
Global Markets Risk Executive, has been designated by ALMRC
as the primary governance authority for global markets risk
management including trading risk management. The GRC’s focus
is to take a forward-looking view of the primary credit and market
risks impacting GBAM and prioritize those that need a proactive
risk mitigation strategy. Market risks that impact businesses
outside of GBAM are monitored and governed by their respective
governance authorities.
The GRC monitors significant daily revenues and losses by
business and the primary drivers of the revenues or losses.
Thresholds are in place for each of our businesses in order to
determine if the revenue or loss is considered to be significant for
that business. If any of the thresholds are exceeded, an
explanation of the variance is provided to the GRC. The thresholds
are developed in coordination with the respective risk managers
to highlight those revenues or losses that exceed what is
considered to be normal daily income statement volatility.