Bank of America 2011 Annual Report Download - page 47
Download and view the complete annual report
Please find page 47 of the 2011 Bank of America annual report below. You can navigate through the pages in the report by either clicking on the pages listed below, or by using the keyword search tool below to find specific information within the annual report.-
 1
1 -
2
-
3
-
4
-
5
-
6
-
7
-
8
-
9
-
10
-
11
-
12
-
13
-
14
-
15
-
16
-
17
-
18
-
19
-
20
-
21
-
22
-
23
-
24
-
25
-
26
-
27
-
28
-
29
-
30
-
31
-
32
-
33
-
34
-
35
-
36
-
 37
37 -
 38
38 -
 39
39 -
 40
40 -
 41
41 -
 42
42 -
 43
43 -
 44
44 -
 45
45 -
 46
46 -
 47
47 -
 48
48 -
 49
49 -
 50
50 -
 51
51 -
 52
52 -
 53
53 -
 54
54 -
 55
55 -
 56
56 -
 57
57 -
58
-
59
-
60
-
61
-
62
-
63
-
64
-
65
-
66
-
67
-
68
-
69
-
70
-
71
-
72
-
73
-
74
-
75
-
76
-
77
-
78
-
79
-
80
-
81
-
82
-
83
-
84
-
85
-
86
-
87
-
88
-
89
-
90
-
91
-
92
-
93
-
94
-
95
-
96
-
97
-
98
-
99
-
100
-
101
-
102
-
103
-
104
-
105
-
106
-
107
-
108
-
109
-
110
-
111
-
112
-
113
-
114
-
115
-
116
-
117
-
118
-
119
-
120
-
121
-
122
-
123
-
124
-
125
-
126
-
127
-
128
-
129
-
130
-
131
-
132
-
133
-
134
-
135
-
136
-
137
-
138
-
139
-
140
-
141
-
142
-
143
-
144
-
145
-
146
-
147
-
148
-
149
-
150
-
151
-
152
-
153
-
154
-
155
-
156
-
157
-
158
-
159
-
160
-
161
-
162
-
163
-
164
-
165
-
166
-
167
-
168
-
169
-
170
-
171
-
172
-
173
-
174
-
175
-
176
-
177
-
178
-
179
-
180
-
181
-
182
-
183
-
184
-
185
-
186
-
187
-
188
-
189
-
190
-
191
-
192
-
193
-
194
-
195
-
196
-
197
-
198
-
199
-
200
-
201
-
202
-
203
-
204
-
205
-
206
-
207
-
208
-
209
-
210
-
211
-
212
-
213
-
214
-
215
-
216
-
217
-
218
-
219
-
220
-
221
-
222
-
223
-
224
-
225
-
226
-
227
-
228
-
229
-
230
-
231
-
232
-
233
-
234
-
235
-
236
-
237
-
238
-
239
-
240
-
241
-
242
-
243
-
244
-
245
-
246
-
247
-
248
-
249
-
250
-
251
-
252
-
253
-
254
-
255
-
256
-
257
-
258
-
259
-
260
-
261
-
262
-
263
-
264
-
265
-
266
-
267
-
268
-
269
-
270
-
271
-
272
-
273
-
274
-
275
-
276
 |
 |

Bank of America 2011 45
Collateralized Debt Obligation and Monoline Exposure
CDO vehicles hold diversified pools of fixed-income securities and
issue multiple tranches of debt securities including commercial
paper, and mezzanine and equity securities. Our CDO-related
exposure can be divided into funded and unfunded super senior
liquidity commitment exposure and other super senior exposure,
including cash positions and derivative contracts. For more
information on our CDO positions, see Note 8 – Securitizations and
Other Variable Interest Entities to the Consolidated Financial
Statements. Super senior exposure represents the most senior
class of notes that are issued by the CDO vehicles and benefits
from the subordination of all other securities issued by the CDO
vehicles. In 2011, we recorded losses of $86 million from our
CDO-related exposure compared to losses of $573 million in 2010.
At December 31, 2011, our super senior CDO exposure before
consideration of insurance, net of write-downs, was $376 million,
comprised solely of trading account assets, compared to $2.0
billion, comprised of $1.3 billion in trading account assets and
$675 million in AFS debt securities at December 31, 2010. Of our
super senior CDO exposure at December 31, 2011, $224 million
was hedged and $152 million was unhedged compared to $772
million hedged and $1.2 billion unhedged at December 31, 2010.
At December 31, 2011, there were no unrealized losses recorded
in accumulated other comprehensive income (OCI) on super senior
cash positions and retained positions from liquidated CDOs
compared to $466 million at December 31, 2010. The change
was the result of sales of ABS CDOs.
With the Merrill Lynch acquisition, we acquired a loan that is
collateralized by U.S. super senior ABS CDOs and recorded in All
Other. For additional information, see All Other on page 48.
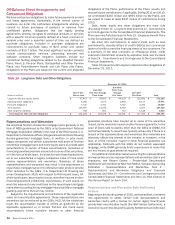
Excluding amounts related to transactions with a single
counterparty, which were transferred to other assets as discussed
below, the table below presents our original total notional, mark-
to-market receivable and credit valuation adjustment for credit
default swaps (CDS) and other positions with monolines.
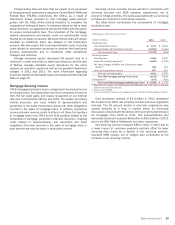
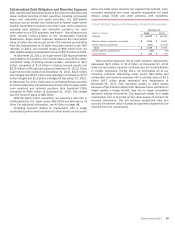
Credit Default Swaps with Monoline Financial Guarantors
(Dollars in millions)
Notional
Mark-to-market or guarantor receivable
Credit valuation adjustment
Total
Credit valuation adjustment %
Gains (losses)
December 31
2011
$ 21,070
$ 1,766
(417)
$ 1,349
24%
$ 116
2010
$ 38,424
$ 9,201
(5,275)
$ 3,926
57%
$ (24)
Total monoline exposure, net of credit valuation adjustments,
decreased $2.6 billion to $1.3 billion at December 31, 2011
driven by terminated monoline contracts and the reclassification
of certain exposures. During 2011, we terminated all of our
monoline contracts referencing super senior ABS CDOs and
reclassified net monoline exposure with a carrying value of $1.3
billion ($4.7 billion gross receivable less impairment) at
December 31, 2011 from derivative assets to other assets
because of the inherent default risk. Because these contracts no
longer provide a hedge benefit, they are no longer considered
derivative trading instruments. This exposure relates to a single
counterparty and is recorded at fair value based on current net
recovery projections. The net recovery projections take into
account the present value of projected payments expected to be
received from the counterparty.