Bank of America 2011 Annual Report Download - page 101
Download and view the complete annual report
Please find page 101 of the 2011 Bank of America annual report below. You can navigate through the pages in the report by either clicking on the pages listed below, or by using the keyword search tool below to find specific information within the annual report.-
 1
1 -
2
-
3
-
4
-
5
-
6
-
7
-
8
-
9
-
10
-
11
-
12
-
13
-
14
-
15
-
16
-
17
-
18
-
19
-
20
-
21
-
22
-
23
-
24
-
25
-
26
-
27
-
28
-
29
-
30
-
31
-
32
-
33
-
34
-
35
-
36
-
37
-
38
-
39
-
40
-
41
-
42
-
43
-
44
-
45
-
46
-
47
-
48
-
49
-
50
-
51
-
52
-
53
-
54
-
55
-
56
-
57
-
58
-
59
-
60
-
61
-
62
-
63
-
64
-
65
-
66
-
67
-
68
-
69
-
70
-
71
-
72
-
73
-
74
-
75
-
76
-
77
-
78
-
79
-
80
-
81
-
82
-
83
-
84
-
85
-
86
-
87
-
88
-
89
-
90
-
 91
91 -
 92
92 -
 93
93 -
 94
94 -
 95
95 -
 96
96 -
 97
97 -
 98
98 -
 99
99 -
 100
100 -
 101
101 -
 102
102 -
 103
103 -
 104
104 -
 105
105 -
 106
106 -
 107
107 -
 108
108 -
 109
109 -
 110
110 -
 111
111 -
112
-
113
-
114
-
115
-
116
-
117
-
118
-
119
-
120
-
121
-
122
-
123
-
124
-
125
-
126
-
127
-
128
-
129
-
130
-
131
-
132
-
133
-
134
-
135
-
136
-
137
-
138
-
139
-
140
-
141
-
142
-
143
-
144
-
145
-
146
-
147
-
148
-
149
-
150
-
151
-
152
-
153
-
154
-
155
-
156
-
157
-
158
-
159
-
160
-
161
-
162
-
163
-
164
-
165
-
166
-
167
-
168
-
169
-
170
-
171
-
172
-
173
-
174
-
175
-
176
-
177
-
178
-
179
-
180
-
181
-
182
-
183
-
184
-
185
-
186
-
187
-
188
-
189
-
190
-
191
-
192
-
193
-
194
-
195
-
196
-
197
-
198
-
199
-
200
-
201
-
202
-
203
-
204
-
205
-
206
-
207
-
208
-
209
-
210
-
211
-
212
-
213
-
214
-
215
-
216
-
217
-
218
-
219
-
220
-
221
-
222
-
223
-
224
-
225
-
226
-
227
-
228
-
229
-
230
-
231
-
232
-
233
-
234
-
235
-
236
-
237
-
238
-
239
-
240
-
241
-
242
-
243
-
244
-
245
-
246
-
247
-
248
-
249
-
250
-
251
-
252
-
253
-
254
-
255
-
256
-
257
-
258
-
259
-
260
-
261
-
262
-
263
-
264
-
265
-
266
-
267
-
268
-
269
-
270
-
271
-
272
-
273
-
274
-
275
-
276
 |
 |

Bank of America 2011 99
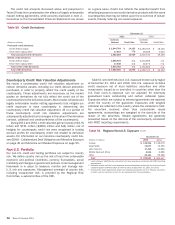
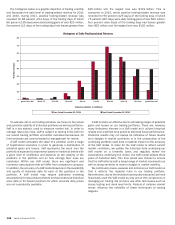
Our total non-U.S. exposure was $232.6 billion at
December 31, 2011, a decrease of $29.4 billion from
December 31, 2010. Our non-U.S. exposure remained
concentrated in Europe which accounted for $115.9 billion, or 50
percent, of total non-U.S. exposure. The European exposure was
mostly in Western Europe and was distributed across a variety of
industries. The decrease of $32.2 billion in Europe was primarily
driven by our efforts to reduce risk in countries affected by the
ongoing debt crisis in the Eurozone. Select European countries
are further detailed in Table 54. Asia Pacific was our second largest
non-U.S. exposure at $74.6 billion, or 32 percent. The $1.3 billion
increase in Asia Pacific was driven by increases in securities and
local exposure in Japan and increases in the emerging markets,
predominately in local exposure, loans and securities offset by the
sale of CCB shares. For more information on our CCB investment,
see Note 5 – Securities to the Consolidated Financial Statements.
Latin America accounted for $17.4 billion, or seven percent, of
total non-U.S. exposure. The $2.6 billion increase in Latin America
was primarily driven by an increase in Brazil in securities and local
country exposure. Middle East and Africa increased $926 million
to $4.6 billion, representing two percent of total non-U.S. exposure.
Other non-U.S. exposure was $20.1 billion at December 31, 2011,
a decrease of $2.1 billion in 2011 resulting primarily from a
decrease in local exposure as a result of the sale of our Canadian
consumer card business. For more information on our Asia Pacific
and Latin America exposure, see non-U.S. exposure to selected
countries defined as emerging markets on page 100.
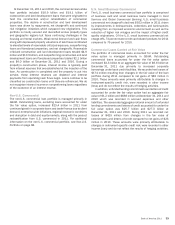
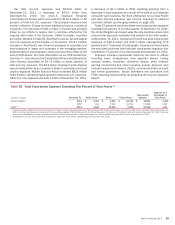
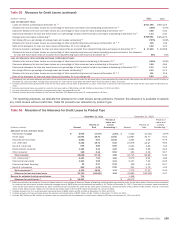
Table 52 presents countries where total cross-border exposure
exceeded one percent of our total assets. At December 31, 2011,
the United Kingdom and Japan were the only countries where total
cross-border exposure exceeded one percent of our total assets.
At December 31, 2011, Canada and France had total cross-border
exposure of $16.9 billion and $16.1 billion representing 0.79
percent and 0.75 percent of total assets. Canada and France were
the only other countries that had total cross-border exposure that
exceeded 0.75 percent of our total assets at December 31, 2011.
Exposure includes cross-border claims by our non-U.S. offices
including loans, acceptances, time deposits placed, trading
account assets, securities, derivative assets, other interest-
earning investments and other monetary assets. Amounts also
include unused commitments, SBLCs, commercial letters of credit
and formal guarantees. Sector definitions are consistent with
FFIEC reporting requirements for preparing the Country Exposure
Report.
Table 52
(Dollars in millions)
United Kingdom
Japan (2)
Total Cross-border Exposure Exceeding One Percent of Total Assets (1)
December 31
2011
2010
2011
Public Sector
$ 6,401
101
4,603
Banks
$ 4,424
5,544
10,383
Private Sector
$ 18,056
32,354
8,060
Cross-border
Exposure
$28,881
37,999
23,046
Exposure as a
Percentage of
Total Assets
1.36%
1.68
1.08
(1) Total cross-border exposure for the United Kingdom and Japan included derivatives exposure of $5.9 billion and $3.5 billion at December 31, 2011 and $2.3 billion and $2.8 billion at December 31,
2010 which has been reduced by the amount of cash collateral applied of $9.3 billion and $1.2 billion at December 31, 2011 and $13.0 billion and $1.6 billion at December 31, 2010. Derivative
assets were collateralized by other marketable securities of $242 million and $1.7 billion at December 31, 2011 and $96 million and $743 million at December 31, 2010.
(2) At December 31, 2010, total cross-border exposure for Japan was $17.0 billion, representing 0.75 percent of total assets.