Bank of America 2011 Annual Report Download - page 87
Download and view the complete annual report
Please find page 87 of the 2011 Bank of America annual report below. You can navigate through the pages in the report by either clicking on the pages listed below, or by using the keyword search tool below to find specific information within the annual report.-
 1
1 -
2
-
3
-
4
-
5
-
6
-
7
-
8
-
9
-
10
-
11
-
12
-
13
-
14
-
15
-
16
-
17
-
18
-
19
-
20
-
21
-
22
-
23
-
24
-
25
-
26
-
27
-
28
-
29
-
30
-
31
-
32
-
33
-
34
-
35
-
36
-
37
-
38
-
39
-
40
-
41
-
42
-
43
-
44
-
45
-
46
-
47
-
48
-
49
-
50
-
51
-
52
-
53
-
54
-
55
-
56
-
57
-
58
-
59
-
60
-
61
-
62
-
63
-
64
-
65
-
66
-
67
-
68
-
69
-
70
-
71
-
72
-
73
-
74
-
75
-
76
-
 77
77 -
 78
78 -
 79
79 -
 80
80 -
 81
81 -
 82
82 -
 83
83 -
 84
84 -
 85
85 -
 86
86 -
 87
87 -
 88
88 -
 89
89 -
 90
90 -
 91
91 -
 92
92 -
 93
93 -
 94
94 -
 95
95 -
 96
96 -
 97
97 -
98
-
99
-
100
-
101
-
102
-
103
-
104
-
105
-
106
-
107
-
108
-
109
-
110
-
111
-
112
-
113
-
114
-
115
-
116
-
117
-
118
-
119
-
120
-
121
-
122
-
123
-
124
-
125
-
126
-
127
-
128
-
129
-
130
-
131
-
132
-
133
-
134
-
135
-
136
-
137
-
138
-
139
-
140
-
141
-
142
-
143
-
144
-
145
-
146
-
147
-
148
-
149
-
150
-
151
-
152
-
153
-
154
-
155
-
156
-
157
-
158
-
159
-
160
-
161
-
162
-
163
-
164
-
165
-
166
-
167
-
168
-
169
-
170
-
171
-
172
-
173
-
174
-
175
-
176
-
177
-
178
-
179
-
180
-
181
-
182
-
183
-
184
-
185
-
186
-
187
-
188
-
189
-
190
-
191
-
192
-
193
-
194
-
195
-
196
-
197
-
198
-
199
-
200
-
201
-
202
-
203
-
204
-
205
-
206
-
207
-
208
-
209
-
210
-
211
-
212
-
213
-
214
-
215
-
216
-
217
-
218
-
219
-
220
-
221
-
222
-
223
-
224
-
225
-
226
-
227
-
228
-
229
-
230
-
231
-
232
-
233
-
234
-
235
-
236
-
237
-
238
-
239
-
240
-
241
-
242
-
243
-
244
-
245
-
246
-
247
-
248
-
249
-
250
-
251
-
252
-
253
-
254
-
255
-
256
-
257
-
258
-
259
-
260
-
261
-
262
-
263
-
264
-
265
-
266
-
267
-
268
-
269
-
270
-
271
-
272
-
273
-
274
-
275
-
276
 |
 |

Bank of America 2011 85
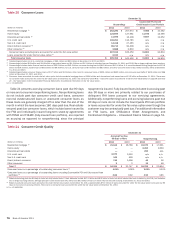
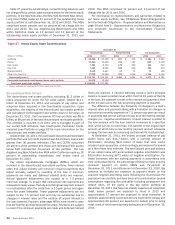
Table 33 presents certain state concentrations for the U.S. credit card portfolio.
Table 33
(Dollars in millions)
California
Florida
Texas
New York
New Jersey
Other U.S.
Total U.S. credit card portfolio
U.S. Credit Card State Concentrations
December 31
Outstandings
2011
$ 15,246
7,999
6,885
6,156
4,183
61,822
$ 102,291
2010
$ 17,028
9,121
7,581
6,862
4,579
68,614
$113,785
Accruing Past Due
90 Days or More
2011
$352
221
131
126
86
1,154
$ 2,070
2010
$ 612
376
207
192
132
1,801
$ 3,320
Net Charge-offs
2011
$ 1,402
838
429
403
275
3,929
$ 7,276
2010
$ 2,752
1,611
784
694
452
6,734
$ 13,027
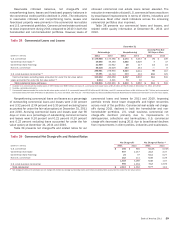
Non-U.S. Credit Card
During 2011, we sold our Canadian consumer card business and
we are evaluating our remaining international consumer card
portfolios. In light of these actions, the international consumer
card portfolios were moved from Card Services to All Other.
Outstandings in the non-U.S. credit card portfolio decreased
$13.0 billion in 2011 primarily due to the sale of the Canadian
consumer credit card portfolio, lower origination volume and
charge-offs. Net charge-offs decreased $1.0 billion in 2011 to
$1.2 billion due to the sale of previously charged-off loans, portfolio
sales, and improvements in delinquencies, collections and
insolvencies.
Unused lines of credit for non-U.S. credit card totaled
$36.8 billion and $60.3 billion at December 31, 2011 and 2010.
The $23.5 billion decrease was driven primarily by the sale of the
Canadian consumer credit card portfolio.
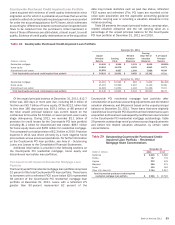
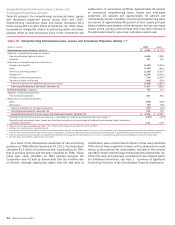
Table 34 presents certain key credit statistics for the non-U.S.
credit card portfolio.
Table 34
(Dollars in millions)
Outstandings
Accruing past due 30 days or more
Accruing past due 90 days or more
Net charge-offs
Net charge-off ratios (1)
Non-U.S. Credit Card – Key Credit Statistics
December 31
2011
$ 14,418
610
342
2011
$ 1,169
4.86%
2010
$ 27,465
1,354
599
2010
$ 2,207
7.88%
(1) Net charge-off ratios are calculated as net charge-offs divided by average outstanding loans
and leases.
Direct/Indirect Consumer
At December 31, 2011, approximately 48 percent of the direct/
indirect portfolio was included in Global Commercial Banking
(dealer financial services - automotive, marine, aircraft and
recreational vehicle loans), 36 percent was included in GWIM
(principally other non-real estate-secured, unsecured personal
loans and securities-based lending margin loans), nine percent
was included in Card Services (consumer personal loans) and the
remainder was in All Other (student loans).
Outstanding loans and leases decreased $595 million to $89.7
billion in 2011 due to lower outstandings in the Card Services
unsecured consumer lending portfolio partially offset by growth in
securities-based lending and product transfers from U.S.
commercial. For 2011, net charge-offs decreased $1.9 billion to
$1.5 billion, or 1.64 percent of total average direct/indirect loans
compared to 3.45 percent for 2010. This decrease was primarily
driven by improvements in delinquencies, collections and
bankruptcies in the unsecured consumer lending portfolio as a
result of an improved economic environment as well as reduced
outstandings. An additional driver was lower net charge-offs in the
dealer financial services portfolio due to the impact of higher credit
quality originations and higher resale values.
Net charge-offs in the unsecured consumer lending portfolio
decreased $1.6 billion to $1.1 billion in 2011, or 10.93 percent
of total average unsecured consumer lending loans compared to
17.24 percent for 2010. Net charge-offs in the dealer financial
services portfolio decreased $199 million to $293 million in 2011,
or 0.69 percent of total average dealer financial services loans
compared to 1.08 percent for 2010. Direct/indirect loans that
were past due 30 days or more and still accruing interest declined
$745 million to $1.9 billion at December 31, 2011 compared to
$2.6 billion at December 31, 2010 due to improvements in both
the unsecured consumer lending and dealer financial services
portfolios.