Bank of America 2011 Annual Report Download - page 181
Download and view the complete annual report
Please find page 181 of the 2011 Bank of America annual report below. You can navigate through the pages in the report by either clicking on the pages listed below, or by using the keyword search tool below to find specific information within the annual report.-
 1
1 -
2
-
3
-
4
-
5
-
6
-
7
-
8
-
9
-
10
-
11
-
12
-
13
-
14
-
15
-
16
-
17
-
18
-
19
-
20
-
21
-
22
-
23
-
24
-
25
-
26
-
27
-
28
-
29
-
30
-
31
-
32
-
33
-
34
-
35
-
36
-
37
-
38
-
39
-
40
-
41
-
42
-
43
-
44
-
45
-
46
-
47
-
48
-
49
-
50
-
51
-
52
-
53
-
54
-
55
-
56
-
57
-
58
-
59
-
60
-
61
-
62
-
63
-
64
-
65
-
66
-
67
-
68
-
69
-
70
-
71
-
72
-
73
-
74
-
75
-
76
-
77
-
78
-
79
-
80
-
81
-
82
-
83
-
84
-
85
-
86
-
87
-
88
-
89
-
90
-
91
-
92
-
93
-
94
-
95
-
96
-
97
-
98
-
99
-
100
-
101
-
102
-
103
-
104
-
105
-
106
-
107
-
108
-
109
-
110
-
111
-
112
-
113
-
114
-
115
-
116
-
117
-
118
-
119
-
120
-
121
-
122
-
123
-
124
-
125
-
126
-
127
-
128
-
129
-
130
-
131
-
132
-
133
-
134
-
135
-
136
-
137
-
138
-
139
-
140
-
141
-
142
-
143
-
144
-
145
-
146
-
147
-
148
-
149
-
150
-
151
-
152
-
153
-
154
-
155
-
156
-
157
-
158
-
159
-
160
-
161
-
162
-
163
-
164
-
165
-
166
-
167
-
168
-
169
-
170
-
 171
171 -
 172
172 -
 173
173 -
 174
174 -
 175
175 -
 176
176 -
 177
177 -
 178
178 -
 179
179 -
 180
180 -
 181
181 -
 182
182 -
 183
183 -
 184
184 -
 185
185 -
 186
186 -
 187
187 -
 188
188 -
 189
189 -
 190
190 -
 191
191 -
192
-
193
-
194
-
195
-
196
-
197
-
198
-
199
-
200
-
201
-
202
-
203
-
204
-
205
-
206
-
207
-
208
-
209
-
210
-
211
-
212
-
213
-
214
-
215
-
216
-
217
-
218
-
219
-
220
-
221
-
222
-
223
-
224
-
225
-
226
-
227
-
228
-
229
-
230
-
231
-
232
-
233
-
234
-
235
-
236
-
237
-
238
-
239
-
240
-
241
-
242
-
243
-
244
-
245
-
246
-
247
-
248
-
249
-
250
-
251
-
252
-
253
-
254
-
255
-
256
-
257
-
258
-
259
-
260
-
261
-
262
-
263
-
264
-
265
-
266
-
267
-
268
-
269
-
270
-
271
-
272
-
273
-
274
-
275
-
276
 |
 |

Bank of America 2011 179
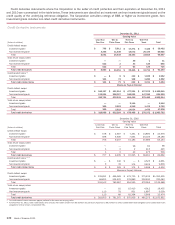
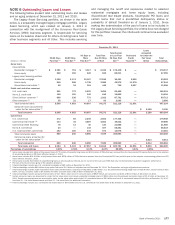
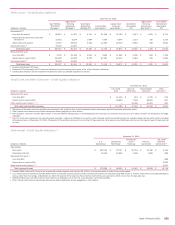
In addition, PCI loans, consumer credit card loans, business card
loans and in general consumer loans not secured by real estate,
including renegotiated loans, are not considered nonperforming
and are therefore excluded from nonperforming loans and leases
in the table below. Real estate-secured past due consumer fully-
insured loans are reported as performing since the principal
repayment is insured. See Note 1 – Summary of Significant
Accounting Principles for further information on the criteria for
classification as nonperforming.
Credit Quality
(Dollars in millions)
Home loans
Core portfolio
Residential mortgage (1)
Home equity
Legacy Asset Servicing portfolio
Residential mortgage (1)
Home equity
Discontinued real estate
Credit card and other consumer
U.S. credit card
Non-U.S. credit card
Direct/Indirect consumer
Other consumer
Total consumer
Commercial
U.S. commercial
Commercial real estate
Commercial lease financing
Non-U.S. commercial
U.S. small business commercial
Total commercial
Total consumer and commercial
Nonperforming Loans
and Leases
December 31
2011
$ 2,414
439
13,556
2,014
290
n/a
n/a
40
15
18,768
2,174
3,880
26
143
114
6,337
$ 25,105
2010
$ 1,510
107
16,181
2,587
331
n/a
n/a
90
48
20,854
3,453
5,829
117
233
204
9,836
$ 30,690
Accruing Past Due
90 Days or More
December 31
2011
$883
—
20,281
—
—
2,070
342
746
2
24,324
75
7
14
—
216
312
$24,636
2010
$16
—
16,752
—
—
3,320
599
1,058
2
21,747
236
47
18
6
325
632
$ 22,379
(1) Residential mortgage loans accruing past due 90 days or more are fully-insured loans. At December 31, 2011 and 2010, residential mortgage includes $17.0 billion and $8.3 billion of loans on
which interest has been curtailed by the FHA, and therefore are no longer accruing interest, although principal is still insured, and $4.2 billion and $8.5 billion of loans on which interest is still
accruing.
n/a = not applicable
Included in certain loan categories in nonperforming loans and
leases in the table above are TDRs that are classified as
nonperforming. At December 31, 2011 and 2010, the Corporation
had $4.7 billion and $3.0 billion of residential mortgages, $539
million and $535 million of home equity, $97 million and $75
million of discontinued real estate, $531 million and $175 million
of U.S. commercial, $1.1 billion and $770 million of commercial
real estate and $38 million and $7 million of non-U.S. commercial
loans that were TDRs and classified as nonperforming.
Credit Quality Indicators
The Corporation monitors credit quality within its three portfolio
segments based on primary credit quality indicators. For more
information on the portfolio segments, see Note 1 – Summary of
Significant Accounting Principles. Within the home loans portfolio
segment, the primary credit quality indicators are refreshed LTV
and refreshed FICO score. Refreshed LTV measures the carrying
value of the loan as a percentage of the value of property securing
the loan, refreshed quarterly. Home equity loans are evaluated
using CLTV which measures the carrying value of the combined
loans that have liens against the property and the available line
of credit as a percentage of the appraised value of the property
securing the loan, refreshed quarterly. Refreshed FICO score
measures the creditworthiness of the borrower based on the
financial obligations of the borrower and the borrower’s credit
history. At a minimum, FICO scores are refreshed quarterly, and in
many cases, more frequently. Refreshed FICO score is also a
primary credit quality indicator for the credit card and other
consumer portfolio segment and the business card portfolio within
U.S. small business commercial. The Corporation’s commercial
loans are evaluated using the internal classifications of pass rated
or reservable criticized as the primary credit quality indicators. The
term reservable criticized refers to those commercial loans that
are internally classified or listed by the Corporation as Special
Mention, Substandard or Doubtful, which are asset categories
defined by regulatory authorities. These assets have an elevated
level of risk and may have a high probability of default or total loss.
Pass rated refers to all loans not considered reservable criticized.
In addition to these primary credit quality indicators, the
Corporation uses other credit quality indicators for certain types
of loans.