Bank of America 2011 Annual Report Download - page 253
Download and view the complete annual report
Please find page 253 of the 2011 Bank of America annual report below. You can navigate through the pages in the report by either clicking on the pages listed below, or by using the keyword search tool below to find specific information within the annual report.-
 1
1 -
2
-
3
-
4
-
5
-
6
-
7
-
8
-
9
-
10
-
11
-
12
-
13
-
14
-
15
-
16
-
17
-
18
-
19
-
20
-
21
-
22
-
23
-
24
-
25
-
26
-
27
-
28
-
29
-
30
-
31
-
32
-
33
-
34
-
35
-
36
-
37
-
38
-
39
-
40
-
41
-
42
-
43
-
44
-
45
-
46
-
47
-
48
-
49
-
50
-
51
-
52
-
53
-
54
-
55
-
56
-
57
-
58
-
59
-
60
-
61
-
62
-
63
-
64
-
65
-
66
-
67
-
68
-
69
-
70
-
71
-
72
-
73
-
74
-
75
-
76
-
77
-
78
-
79
-
80
-
81
-
82
-
83
-
84
-
85
-
86
-
87
-
88
-
89
-
90
-
91
-
92
-
93
-
94
-
95
-
96
-
97
-
98
-
99
-
100
-
101
-
102
-
103
-
104
-
105
-
106
-
107
-
108
-
109
-
110
-
111
-
112
-
113
-
114
-
115
-
116
-
117
-
118
-
119
-
120
-
121
-
122
-
123
-
124
-
125
-
126
-
127
-
128
-
129
-
130
-
131
-
132
-
133
-
134
-
135
-
136
-
137
-
138
-
139
-
140
-
141
-
142
-
143
-
144
-
145
-
146
-
147
-
148
-
149
-
150
-
151
-
152
-
153
-
154
-
155
-
156
-
157
-
158
-
159
-
160
-
161
-
162
-
163
-
164
-
165
-
166
-
167
-
168
-
169
-
170
-
171
-
172
-
173
-
174
-
175
-
176
-
177
-
178
-
179
-
180
-
181
-
182
-
183
-
184
-
185
-
186
-
187
-
188
-
189
-
190
-
191
-
192
-
193
-
194
-
195
-
196
-
197
-
198
-
199
-
200
-
201
-
202
-
203
-
204
-
205
-
206
-
207
-
208
-
209
-
210
-
211
-
212
-
213
-
214
-
215
-
216
-
217
-
218
-
219
-
220
-
221
-
222
-
223
-
224
-
225
-
226
-
227
-
228
-
229
-
230
-
231
-
232
-
233
-
234
-
235
-
236
-
237
-
238
-
239
-
240
-
241
-
242
-
 243
243 -
 244
244 -
 245
245 -
 246
246 -
 247
247 -
 248
248 -
 249
249 -
 250
250 -
 251
251 -
 252
252 -
 253
253 -
 254
254 -
 255
255 -
 256
256 -
 257
257 -
 258
258 -
 259
259 -
 260
260 -
 261
261 -
 262
262 -
 263
263 -
264
-
265
-
266
-
267
-
268
-
269
-
270
-
271
-
272
-
273
-
274
-
275
-
276
 |
 |

Bank of America 2011 251
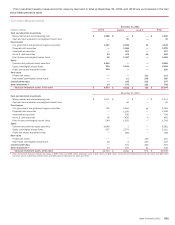
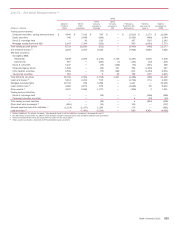
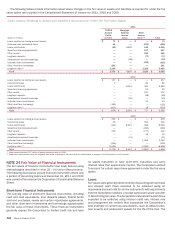
The following tables present a reconciliation of all assets and liabilities measured at fair value on a recurring basis using significant
unobservable inputs (Level 3) during 2011, 2010 and 2009, including net realized and unrealized gains (losses) included in earnings
and accumulated OCI.
Level 3 – Fair Value Measurements (1)
(Dollars in millions)
Trading account assets:
Corporate securities, trading
loans and other (2)
Equity securities
Non-U.S. sovereign debt
Mortgage trading loans and ABS
Total trading account assets
Net derivative assets (3)
AFS debt securities:
Mortgage-backed securities:
Agency
Agency-collateralized
mortgage obligations
Non-agency residential
Non-agency commercial
Non-U.S. securities
Corporate/Agency bonds
Other taxable securities
Tax-exempt securities
Total AFS debt securities
Loans and leases (2, 4)
Mortgage servicing rights (4)
Loans held-for-sale (2)
Other assets (5)
Trading account liabilities –
Corporate securities and other
Other short-term borrowings (2)
Accrued expenses and other
liabilities (2)
Long-term debt (2)
2011
Balance
January 1
2011
$ 7,751
557
243
6,908
15,459
7,745
4
—
1,468
19
3
137
13,018
1,224
15,873
3,321
14,900
4,140
6,922
(7)
(706)
(828)
(2,986)
Consolidation
of VIEs
$—
—
—
—
—
—
—
—
—
—
—
—
—
—
—
5,194
—
—
—
—
—
—
—
Gains
(Losses)
in Earnings
$ 490
49
87
442
1,068
5,199
—
—
(158)
—
—
(12)
26
21
(123)
(55)
(5,661)
36
140
4
(30)
61
(188)
Gains
(Losses)
in OCI
$—
—
—
—
—
—
—
—
41
—
—
(8)
21
(35)
19
—
—
—
—
—
—
—
—
Gross
Purchases
$ 5,683
335
188
2,222
8,428
1,235
14
56
11
15
—
304
3,876
2,862
7,138
21
—
157
1,932
133
—
—
520
Sales
$(6,664)
(362)
(137)
(4,713)
(11,876)
(1,553)
(11)
(56)
(307)
—
—
(17)
(2,245)
(92)
(2,728)
(2,644)
(896)
(483)
(2,391)
(189)
—
(2)
(72)
Issuances
$—
—
—
—
—
—
—
—
—
—
—
—
—
—
—
3,118
1,656
—
—
—
—
(9)
(520)
Settlements
$(1,362)
(140)
(3)
(440)
(1,945)
(7,779)
—
—
(568)
—
—
—
(5,112)
(697)
(6,377)
(1,830)
(2,621)
(961)
(768)
—
86
3
838
Gross
Transfers
into
Level 3
$ 1,695
132
8
75
1,910
1,199
34
—
373
6
88
7
2
38
548
5
—
565
375
(65)
—
—
(2,111)
Gross
Transfers
out of
Level 3
$(713)
(27)
(44)
(805)
(1,589)
(180)
(4)
—
—
—
(91)
(249)
(5,321)
(673)
(6,338)
(4,386)
—
(67)
(1,975)
10
650
761
1,576
Balance
December 31
2011
$ 6,880
544
342
3,689
11,455
5,866
37
—
860
40
—
162
4,265
2,648
8,012
2,744
7,378
3,387
4,235
(114)
—
(14)
(2,943)
(1) Assets (liabilities). For assets, increase / (decrease) to Level 3 and for liabilities, (increase) / decrease to Level 3.
(2) Amounts represent items that are accounted for under the fair value option.
(3) Net derivatives at December 31, 2011 include derivative assets of $14.4 billion and derivative liabilities of $8.5 billion.
(4) Issuances represent loan originations and mortgage servicing rights retained following securitizations or whole loan sales.
(5) Other assets is primarily comprised of net monoline exposure to a single counterparty and private equity investments.
During 2011, the transfers into Level 3 included $1.9 billion of
trading account assets, $1.2 billion of net derivative assets and
$2.1 billion of long-term debt accounted for under the fair value
option. Transfers into Level 3 for trading account assets were
primarily certain CLOs, corporate loans and bonds which were
transferred due to decreased market activity. Transfers into Level
3 for net derivative assets were the result of changes in the
valuation methodology for certain total return swaps, in addition
to increases in certain equity derivatives with significant
unobservable inputs. Transfers into Level 3 for long-term debt were
primarily due to changes in the impact of unobservable inputs on
the value of certain structured liabilities. Transfers occur on a
regular basis for these long-term debt instruments based on the
fair value of the embedded derivative in relation to the instrument
as a whole.
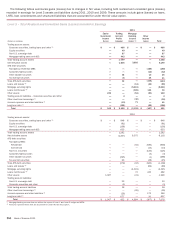
During 2011, the transfers out of Level 3 included $1.6 billion
of trading account assets, $6.3 billion of AFS debt securities, $4.4
billion of loans and leases, $2.0 billion of other assets and $1.6
billion of long-term debt. Transfers out of Level 3 for trading account
assets were primarily driven by increased price observability on
certain RMBS, commercial mortgage-backed securities and
consumer ABS portfolios as well as certain corporate bond
positions due to increased trading volume. Transfers out of Level
3 for AFS debt securities primarily related to auto, credit card and
student loan ABS portfolios due to increased trading volume in
the secondary market for similar securities. Transfers out of Level
3 for loans and leases were driven by increased observable inputs,
primarily market comparables, for certain corporate loans
accounted for under the fair value option. Transfers out of Level
3 for other assets were primarily the result of an initial public
offering of an equity investment. Transfers out of Level 3 for long-
term debt were primarily due to changes in the impact of
unobservable inputs on the value of certain structured liabilities.
Transfers occur on a regular basis for these long-term debt
instruments based on the fair value of the embedded derivative
in relation to the instrument as a whole.