Bank of America 2011 Annual Report Download - page 135
Download and view the complete annual report
Please find page 135 of the 2011 Bank of America annual report below. You can navigate through the pages in the report by either clicking on the pages listed below, or by using the keyword search tool below to find specific information within the annual report.-
 1
1 -
2
-
3
-
4
-
5
-
6
-
7
-
8
-
9
-
10
-
11
-
12
-
13
-
14
-
15
-
16
-
17
-
18
-
19
-
20
-
21
-
22
-
23
-
24
-
25
-
26
-
27
-
28
-
29
-
30
-
31
-
32
-
33
-
34
-
35
-
36
-
37
-
38
-
39
-
40
-
41
-
42
-
43
-
44
-
45
-
46
-
47
-
48
-
49
-
50
-
51
-
52
-
53
-
54
-
55
-
56
-
57
-
58
-
59
-
60
-
61
-
62
-
63
-
64
-
65
-
66
-
67
-
68
-
69
-
70
-
71
-
72
-
73
-
74
-
75
-
76
-
77
-
78
-
79
-
80
-
81
-
82
-
83
-
84
-
85
-
86
-
87
-
88
-
89
-
90
-
91
-
92
-
93
-
94
-
95
-
96
-
97
-
98
-
99
-
100
-
101
-
102
-
103
-
104
-
105
-
106
-
107
-
108
-
109
-
110
-
111
-
112
-
113
-
114
-
115
-
116
-
117
-
118
-
119
-
120
-
121
-
122
-
123
-
124
-
 125
125 -
 126
126 -
 127
127 -
 128
128 -
 129
129 -
 130
130 -
 131
131 -
 132
132 -
 133
133 -
 134
134 -
 135
135 -
 136
136 -
 137
137 -
 138
138 -
 139
139 -
 140
140 -
 141
141 -
 142
142 -
 143
143 -
 144
144 -
 145
145 -
146
-
147
-
148
-
149
-
150
-
151
-
152
-
153
-
154
-
155
-
156
-
157
-
158
-
159
-
160
-
161
-
162
-
163
-
164
-
165
-
166
-
167
-
168
-
169
-
170
-
171
-
172
-
173
-
174
-
175
-
176
-
177
-
178
-
179
-
180
-
181
-
182
-
183
-
184
-
185
-
186
-
187
-
188
-
189
-
190
-
191
-
192
-
193
-
194
-
195
-
196
-
197
-
198
-
199
-
200
-
201
-
202
-
203
-
204
-
205
-
206
-
207
-
208
-
209
-
210
-
211
-
212
-
213
-
214
-
215
-
216
-
217
-
218
-
219
-
220
-
221
-
222
-
223
-
224
-
225
-
226
-
227
-
228
-
229
-
230
-
231
-
232
-
233
-
234
-
235
-
236
-
237
-
238
-
239
-
240
-
241
-
242
-
243
-
244
-
245
-
246
-
247
-
248
-
249
-
250
-
251
-
252
-
253
-
254
-
255
-
256
-
257
-
258
-
259
-
260
-
261
-
262
-
263
-
264
-
265
-
266
-
267
-
268
-
269
-
270
-
271
-
272
-
273
-
274
-
275
-
276
 |
 |

Bank of America 2011 133
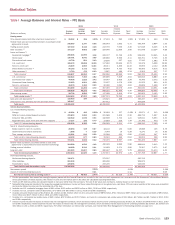
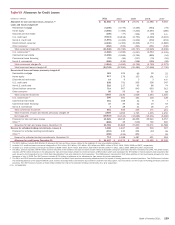
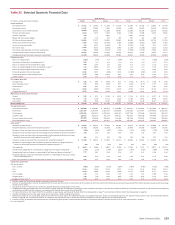
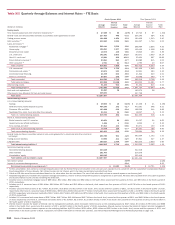
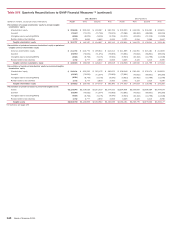
Table XII Selected Quarterly Financial Data
(In millions, except per share information)
Income statement
Net interest income
Noninterest income
Total revenue, net of interest expense
Provision for credit losses
Goodwill impairment
Merger and restructuring charges
All other noninterest expense (1)
Income (loss) before income taxes
Income tax expense (benefit)
Net income (loss)
Net income (loss) applicable to common shareholders
Average common shares issued and outstanding
Average diluted common shares issued and outstanding (2)
Performance ratios
Return on average assets
Four quarter trailing return on average assets (3)
Return on average common shareholders’ equity
Return on average tangible common shareholders’ equity (4)
Return on average tangible shareholders’ equity (4)
Total ending equity to total ending assets
Total average equity to total average assets
Dividend payout
Per common share data
Earnings (loss)
Diluted earnings (loss) (2)
Dividends paid
Book value
Tangible book value (4)
Market price per share of common stock
Closing
High closing
Low closing
Market capitalization
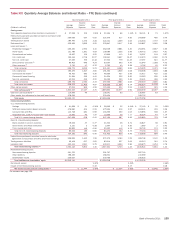
Average balance sheet
Total loans and leases
Total assets
Total deposits
Long-term debt
Common shareholders’ equity
Total shareholders’ equity
Asset quality (5)
Allowance for credit losses (6)
Nonperforming loans, leases and foreclosed properties (7)
Allowance for loan and lease losses as a percentage of total loans and leases outstanding (7)
Allowance for loan and lease losses as a percentage of total nonperforming loans and leases (7)
Allowance for loan and lease losses as a percentage of total nonperforming loans and leases
excluding the purchased credit-impaired loan portfolio (6)
Amounts included in allowance that are excluded from nonperforming loans (8)
Allowance as a percentage of total nonperforming loans and leases excluding the amounts
included in the allowance that are excluded from nonperforming loans (8)
Net charge-offs
Annualized net charge-offs as a percentage of average loans and leases outstanding (7)
Nonperforming loans and leases as a percentage of total loans and leases outstanding (7)
Nonperforming loans, leases and foreclosed properties as a percentage of total loans, leases
and foreclosed properties (7)
Ratio of the allowance for loan and lease losses at period end to annualized net charge-offs
Capital ratios (period end)
Risk-based capital:
Tier 1 common
Tier 1
Total
Tier 1 leverage
Tangible equity (4)
Tangible common equity (4)
2011 Quarters
Fourth
$ 10,701
14,187
24,888
2,934
581
101
18,840
2,432
441
1,991
1,584
10,281
11,125
0.36%
0.06
3.00
4.72
5.20
10.81
10.34
6.60
$0.15
0.15
0.01
20.09
12.95
$5.56
7.35
4.99
$ 58,580
$ 932,898
2,207,567
1,032,531
389,557
209,324
228,235
$ 34,497
27,708
3.68%
135
101
$ 17,490
65%
$ 4,054
1.74%
2.74
3.01
2.10
9.86%
12.40
16.75
7.53
7.54
6.64
Third
$ 10,490
17,963
28,453
3,407
—
176
17,437
7,433
1,201
6,232
5,889
10,116
10,464
1.07%
n/m
11.40
18.30
17.03
10.37
9.66
1.73
$ 0.58
0.56
0.01
20.80
13.22
$ 6.12
11.09
6.06
$ 62,023
$ 942,032
2,301,454
1,051,320
420,273
204,928
222,410
$ 35,872
29,059
3.81%
133
101
$ 18,317
63%
$ 5,086
2.17%
2.87
3.15
1.74
8.65%
11.48
15.86
7.11
7.16
6.25
Second
$ 11,246
1,990
13,236
3,255
2,603
159
20,094
(12,875)
(4,049)
(8,826)
(9,127)
10,095
10,095
n/m
n/m
n/m
n/m
n/m
9.83%
10.05
n/m
$ (0.90)
(0.90)
0.01
20.29
12.65
$ 10.96
13.72
10.50
$ 111,060
$ 938,513
2,339,110
1,035,944
435,144
218,505
235,067
$ 38,209
30,058
4.00%
135
105
$ 19,935
63%
$ 5,665
2.44%
2.96
3.22
1.64
8.23%
11.00
15.65
6.86
6.63
5.87
First
$ 12,179
14,698
26,877
3,814
—
202
20,081
2,780
731
2,049
1,739
10,076
10,181
0.36%
n/m
3.29
5.28
5.54
10.15
9.87
6.06
$ 0.17
0.17
0.01
21.15
13.21
$ 13.33
15.25
13.33
$ 135,057
$ 938,966
2,338,538
1,023,140
440,511
214,206
230,769
$ 40,804
31,643
4.29%
135
108
$ 22,110
60%
$ 6,028
2.61%
3.19
3.40
1.63
8.64%
11.32
15.98
7.25
6.85
6.10
2010 Quarters
Fourth
$ 12,439
9,959
22,398
5,129
2,000
370
18,494
(3,595)
(2,351)
(1,244)
(1,565)
10,037
10,037
n/m
n/m
n/m
n/m
n/m
10.08%
9.94
n/m
$ (0.16)
(0.16)
0.01
20.99
12.98
$ 13.34
13.56
10.95
$ 134,536
$ 940,614
2,370,258
1,007,738
465,875
218,728
235,525
$ 43,073
32,664
4.47%
136
116
$ 22,908
62%
$ 6,783
2.87%
3.27
3.48
1.56
8.60%
11.24
15.77
7.21
6.75
5.99
Third
$ 12,435
14,265
26,700
5,396
10,400
421
16,395
(5,912)
1,387
(7,299)
(7,647)
9,976
9,976
n/m
n/m
n/m
n/m
n/m
9.85%
9.83
n/m
$ (0.77)
(0.77)
0.01
21.17
12.91
$ 13.10
15.67
12.32
$ 131,442
$ 934,860
2,379,397
973,846
485,588
215,911
233,978
$ 44,875
34,556
4.69%
135
118
$ 23,661
62%
$ 7,197
3.07%
3.47
3.71
1.53
8.45%
11.16
15.65
7.21
6.54
5.74
Second
$ 12,900
16,253
29,153
8,105
—
508
16,745
3,795
672
3,123
2,783
9,957
10,030
0.50%
0.21
5.18
9.19
8.98
9.85
9.36
3.63
$ 0.28
0.27
0.01
21.45
12.14
$ 14.37
19.48
14.37
$ 144,174
$ 967,054
2,494,432
991,615
497,469
215,468
233,461
$ 46,668
35,598
4.75%
137
121
$ 24,338
63%
$ 9,557
3.98%
3.48
3.73
1.18
8.01%
10.67
14.77
6.68
6.14
5.35
First
$ 13,749
18,220
31,969
9,805
—
521
17,254
4,389
1,207
3,182
2,834
9,177
10,005
0.51%
0.21
5.73
9.79
9.55
9.80
9.14
3.57
$ 0.28
0.28
0.01
21.12
11.70
$ 17.85
18.04
14.45
$ 179,071
$ 991,615
2,516,590
981,015
513,634
200,380
229,891
$ 48,356
35,925
4.82%
139
124
$ 26,199
61%
$ 10,797
4.44%
3.46
3.69
1.07
7.60%
10.23
14.47
6.44
6.02
5.22
(1) Excludes merger and restructuring charges and goodwill impairment charges.
(2) Due to a net loss applicable to common shareholders for the second quarter of 2011 and the fourth and third quarters of 2010, the impact of antidilutive equity instruments was excluded from diluted earnings (loss) per share and average
diluted common shares.
(3) Calculated as total net income for four consecutive quarters divided by average assets for the period.
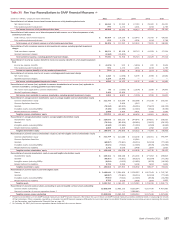
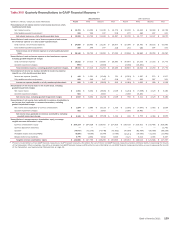
(4) Tangible equity ratios and tangible book value per share of common stock are non-GAAP financial measures. Other companies may define or calculate these measures differently. For additional information on these ratios and corresponding
reconciliations to GAAP financial measures, see Supplemental Financial Data on page 32 and Table XVII.
(5) For more information on the impact of the PCI loan portfolio on asset quality, see Consumer Portfolio Credit Risk Management on page 75 and Commercial Portfolio Credit Risk Management on page 88.
(6) Includes the allowance for loan and lease losses and the reserve for unfunded lending commitments.
(7) Balances and ratios do not include loans accounted for under the fair value option. For additional exclusions on nonperforming loans, leases and foreclosed properties, see Nonperforming Consumer Loans and Foreclosed Properties
Activity on page 86 and corresponding Table 36, and Nonperforming Commercial Loans, Leases and Foreclosed Properties Activity on page 94 and corresponding Table 45.
(8) Amounts included in allowance that are excluded from nonperforming loans primarily include amounts allocated to Card Services portfolio, PCI loans and the non-U.S. credit card portfolio in All Other.
n/m = not meaningful