Bank of America 2011 Annual Report Download - page 151
Download and view the complete annual report
Please find page 151 of the 2011 Bank of America annual report below. You can navigate through the pages in the report by either clicking on the pages listed below, or by using the keyword search tool below to find specific information within the annual report.-
 1
1 -
2
-
3
-
4
-
5
-
6
-
7
-
8
-
9
-
10
-
11
-
12
-
13
-
14
-
15
-
16
-
17
-
18
-
19
-
20
-
21
-
22
-
23
-
24
-
25
-
26
-
27
-
28
-
29
-
30
-
31
-
32
-
33
-
34
-
35
-
36
-
37
-
38
-
39
-
40
-
41
-
42
-
43
-
44
-
45
-
46
-
47
-
48
-
49
-
50
-
51
-
52
-
53
-
54
-
55
-
56
-
57
-
58
-
59
-
60
-
61
-
62
-
63
-
64
-
65
-
66
-
67
-
68
-
69
-
70
-
71
-
72
-
73
-
74
-
75
-
76
-
77
-
78
-
79
-
80
-
81
-
82
-
83
-
84
-
85
-
86
-
87
-
88
-
89
-
90
-
91
-
92
-
93
-
94
-
95
-
96
-
97
-
98
-
99
-
100
-
101
-
102
-
103
-
104
-
105
-
106
-
107
-
108
-
109
-
110
-
111
-
112
-
113
-
114
-
115
-
116
-
117
-
118
-
119
-
120
-
121
-
122
-
123
-
124
-
125
-
126
-
127
-
128
-
129
-
130
-
131
-
132
-
133
-
134
-
135
-
136
-
137
-
138
-
139
-
140
-
 141
141 -
 142
142 -
 143
143 -
 144
144 -
 145
145 -
 146
146 -
 147
147 -
 148
148 -
 149
149 -
 150
150 -
 151
151 -
 152
152 -
 153
153 -
 154
154 -
 155
155 -
 156
156 -
 157
157 -
 158
158 -
 159
159 -
 160
160 -
 161
161 -
162
-
163
-
164
-
165
-
166
-
167
-
168
-
169
-
170
-
171
-
172
-
173
-
174
-
175
-
176
-
177
-
178
-
179
-
180
-
181
-
182
-
183
-
184
-
185
-
186
-
187
-
188
-
189
-
190
-
191
-
192
-
193
-
194
-
195
-
196
-
197
-
198
-
199
-
200
-
201
-
202
-
203
-
204
-
205
-
206
-
207
-
208
-
209
-
210
-
211
-
212
-
213
-
214
-
215
-
216
-
217
-
218
-
219
-
220
-
221
-
222
-
223
-
224
-
225
-
226
-
227
-
228
-
229
-
230
-
231
-
232
-
233
-
234
-
235
-
236
-
237
-
238
-
239
-
240
-
241
-
242
-
243
-
244
-
245
-
246
-
247
-
248
-
249
-
250
-
251
-
252
-
253
-
254
-
255
-
256
-
257
-
258
-
259
-
260
-
261
-
262
-
263
-
264
-
265
-
266
-
267
-
268
-
269
-
270
-
271
-
272
-
273
-
274
-
275
-
276
 |
 |

Bank of America 2011 149
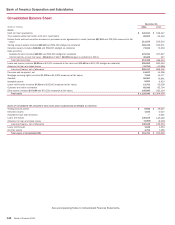
Bank of America Corporation and Subsidiaries
Consolidated Balance Sheet (continued)
(Dollars in millions)
Liabilities
Deposits in U.S. offices:
Noninterest-bearing
Interest-bearing (includes $3,297 and $2,732 measured at fair value)
Deposits in non-U.S. offices:
Noninterest-bearing
Interest-bearing
Total deposits
Federal funds purchased and securities loaned or sold under agreements to repurchase (includes $34,235 and $37,424 measured at fair
value)
Trading account liabilities
Derivative liabilities
Commercial paper and other short-term borrowings (includes $6,558 and $7,178 measured at fair value)
Accrued expenses and other liabilities (includes $15,743 and $33,229 measured at fair value and $714 and $1,188 of reserve for
unfunded lending commitments)
Long-term debt (includes $46,239 and $50,984 measured at fair value)
Total liabilities
Commitments and contingencies (Note 8 – Securitizations and Other Variable Interest Entities, Note 9 – Representations and Warranties
Obligations and Corporate Guarantees and Note 14 – Commitments and Contingencies)
Shareholders’ equity
Preferred stock, $0.01 par value; authorized – 100,000,000 shares; issued and outstanding – 3,689,084 and 3,943,660 shares
Common stock and additional paid-in capital, $0.01 par value; authorized – 12,800,000,000 shares; issued and outstanding –
10,535,937,957 and 10,085,154,806 shares
Retained earnings
Accumulated other comprehensive income (loss)
Other
Total shareholders’ equity
Total liabilities and shareholders’ equity
Liabilities of consolidated VIEs included in total liabilities above
Commercial paper and other short-term borrowings (includes $650 and $706 of non-recourse liabilities)
Long-term debt (includes $44,976 and $66,309 of non-recourse debt)
All other liabilities (includes $225 and $382 of non-recourse liabilities)
Total liabilities of consolidated VIEs
December 31
2011
$ 332,228
624,814
6,839
69,160
1,033,041
214,864
60,508
59,520
35,698
123,049
372,265
1,898,945
18,397
156,621
60,520
(5,437)
—
230,101
$2,129,046
$ 5,777
49,054
1,116
$55,947
2010
$ 285,200
645,713
6,101
73,416
1,010,430
245,359
71,985
55,914
59,962
144,580
448,431
2,036,661
16,562
150,905
60,849
(66)
(2)
228,248
$2,264,909
$ 6,742
71,013
9,141
$ 86,896
See accompanying Notes to Consolidated Financial Statements.