Bank of America 2011 Annual Report Download - page 240
Download and view the complete annual report
Please find page 240 of the 2011 Bank of America annual report below. You can navigate through the pages in the report by either clicking on the pages listed below, or by using the keyword search tool below to find specific information within the annual report.-
 1
1 -
2
-
3
-
4
-
5
-
6
-
7
-
8
-
9
-
10
-
11
-
12
-
13
-
14
-
15
-
16
-
17
-
18
-
19
-
20
-
21
-
22
-
23
-
24
-
25
-
26
-
27
-
28
-
29
-
30
-
31
-
32
-
33
-
34
-
35
-
36
-
37
-
38
-
39
-
40
-
41
-
42
-
43
-
44
-
45
-
46
-
47
-
48
-
49
-
50
-
51
-
52
-
53
-
54
-
55
-
56
-
57
-
58
-
59
-
60
-
61
-
62
-
63
-
64
-
65
-
66
-
67
-
68
-
69
-
70
-
71
-
72
-
73
-
74
-
75
-
76
-
77
-
78
-
79
-
80
-
81
-
82
-
83
-
84
-
85
-
86
-
87
-
88
-
89
-
90
-
91
-
92
-
93
-
94
-
95
-
96
-
97
-
98
-
99
-
100
-
101
-
102
-
103
-
104
-
105
-
106
-
107
-
108
-
109
-
110
-
111
-
112
-
113
-
114
-
115
-
116
-
117
-
118
-
119
-
120
-
121
-
122
-
123
-
124
-
125
-
126
-
127
-
128
-
129
-
130
-
131
-
132
-
133
-
134
-
135
-
136
-
137
-
138
-
139
-
140
-
141
-
142
-
143
-
144
-
145
-
146
-
147
-
148
-
149
-
150
-
151
-
152
-
153
-
154
-
155
-
156
-
157
-
158
-
159
-
160
-
161
-
162
-
163
-
164
-
165
-
166
-
167
-
168
-
169
-
170
-
171
-
172
-
173
-
174
-
175
-
176
-
177
-
178
-
179
-
180
-
181
-
182
-
183
-
184
-
185
-
186
-
187
-
188
-
189
-
190
-
191
-
192
-
193
-
194
-
195
-
196
-
197
-
198
-
199
-
200
-
201
-
202
-
203
-
204
-
205
-
206
-
207
-
208
-
209
-
210
-
211
-
212
-
213
-
214
-
215
-
216
-
217
-
218
-
219
-
220
-
221
-
222
-
223
-
224
-
225
-
226
-
227
-
228
-
229
-
 230
230 -
 231
231 -
 232
232 -
 233
233 -
 234
234 -
 235
235 -
 236
236 -
 237
237 -
 238
238 -
 239
239 -
 240
240 -
 241
241 -
 242
242 -
 243
243 -
 244
244 -
 245
245 -
 246
246 -
 247
247 -
 248
248 -
 249
249 -
 250
250 -
251
-
252
-
253
-
254
-
255
-
256
-
257
-
258
-
259
-
260
-
261
-
262
-
263
-
264
-
265
-
266
-
267
-
268
-
269
-
270
-
271
-
272
-
273
-
274
-
275
-
276
 |
 |

238 Bank of America 2011
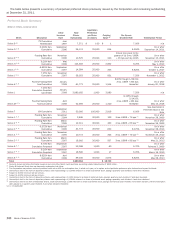
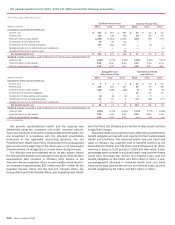
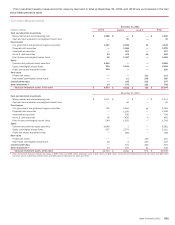
Net periodic benefit cost for 2011, 2010 and 2009 included the following components.
Net Periodic Benefit Cost
(Dollars in millions)
Components of net periodic benefit cost
Service cost
Interest cost
Expected return on plan assets
Amortization of prior service cost
Amortization of net actuarial loss (gain)
Recognized gain due to settlements and curtailments
Recognized termination benefit costs
Net periodic benefit cost
Weighted-average assumptions used to determine net cost for years ended December 31
Discount rate
Expected return on plan assets
Rate of compensation increase
(Dollars in millions)
Components of net periodic benefit cost
Service cost
Interest cost
Expected return on plan assets
Amortization of transition obligation
Amortization of prior service cost (credits)
Amortization of net actuarial loss (gain)
Recognized loss due to settlements and curtailments
Net periodic benefit cost
Weighted-average assumptions used to determine net cost for years ended December 31
Discount rate
Expected return on plan assets
Rate of compensation increase
Qualified Pension Plans
2011
$423
746
(1,296)
20
387
—
—
$280
5.45%
8.00
4.00
Nonqualified and
Other Pension Plans
2011
$3
152
(141)
—
(8)
16
3
$25
5.20%
5.25
4.00
2010
$ 397
748
(1,263)
28
362
—
—
$ 272
5.75%
8.00
4.00
2010
$3
163
(138)
—
(8)
10
17
$47
5.75%
5.25
4.00
2009
$ 387
740
(1,231)
39
377
—
36
$ 348
6.00%
8.00
4.00
2009
$4
167
(148)
—
(8)
5
2
$22
6.00%
5.25
4.00
Non-U.S. Pension Plans
2011
$43
99
(115)
—
—
—
—
$27
5.32%
6.58
4.85
Postretirement Health
and Life Plans
2011
$15
80
(9)
31
4
(17)
—
$104
5.10%
8.00
n/a
2010
$32
95
(97)
—
(1)
—
—
$29
5.41%
6.60
4.67
2010
$14
92
(9)
31
6
(49)
—
$85
5.75%
8.00
n/a
2009
$30
76
(74)
—
—
(2)
—
$30
5.55%
6.78
4.61
2009
$16
93
(8)
31
—
(77)
—
$55
6.00%
8.00
n/a
n/a = not applicable
Net periodic postretirement health and life expense was
determined using the “projected unit credit” actuarial method.
Gains and losses for all benefits except postretirement health care
are recognized in accordance with the standard amortization
provisions of the applicable accounting guidance. For the
Postretirement Health Care Plans, 50 percent of the unrecognized
gain or loss at the beginning of the fiscal year (or at subsequent
remeasurement) is recognized on a level basis during the year.
The discount rate and expected return on plan assets impact
the net periodic benefit cost recorded for the plans. With all other
assumptions held constant, a 25-basis point decline in the
discount rate and expected return on plan assets would result in
an increase of approximately $55 million and $27 million for the
Qualified Pension Plans. For the Non-U.S. Pension Plans, the
Nonqualified and Other Pension Plans, and Postretirement Health
and Life Plans, the 25-basis point decline in rates would not have
a significant impact.
Assumed health care cost trend rates affect the postretirement
benefit obligation and benefit cost reported for the Postretirement
Health and Life Plans. The assumed health care cost trend rate
used to measure the expected cost of benefits covered by the
Postretirement Health and Life Plans was 8.00 percent for 2012,
reducing in steps to 5.00 percent in 2019 and later years. A one-
percentage-point increase in assumed health care cost trend rates
would have increased the service and interest costs, and the
benefit obligation by $4 million and $59 million in 2011. A one-
percentage-point decrease in assumed health care cost trend
rates would have lowered the service and interest costs, and the
benefit obligation by $3 million and $52 million in 2011.