Bank of America 2011 Annual Report Download - page 234
Download and view the complete annual report
Please find page 234 of the 2011 Bank of America annual report below. You can navigate through the pages in the report by either clicking on the pages listed below, or by using the keyword search tool below to find specific information within the annual report.-
 1
1 -
2
-
3
-
4
-
5
-
6
-
7
-
8
-
9
-
10
-
11
-
12
-
13
-
14
-
15
-
16
-
17
-
18
-
19
-
20
-
21
-
22
-
23
-
24
-
25
-
26
-
27
-
28
-
29
-
30
-
31
-
32
-
33
-
34
-
35
-
36
-
37
-
38
-
39
-
40
-
41
-
42
-
43
-
44
-
45
-
46
-
47
-
48
-
49
-
50
-
51
-
52
-
53
-
54
-
55
-
56
-
57
-
58
-
59
-
60
-
61
-
62
-
63
-
64
-
65
-
66
-
67
-
68
-
69
-
70
-
71
-
72
-
73
-
74
-
75
-
76
-
77
-
78
-
79
-
80
-
81
-
82
-
83
-
84
-
85
-
86
-
87
-
88
-
89
-
90
-
91
-
92
-
93
-
94
-
95
-
96
-
97
-
98
-
99
-
100
-
101
-
102
-
103
-
104
-
105
-
106
-
107
-
108
-
109
-
110
-
111
-
112
-
113
-
114
-
115
-
116
-
117
-
118
-
119
-
120
-
121
-
122
-
123
-
124
-
125
-
126
-
127
-
128
-
129
-
130
-
131
-
132
-
133
-
134
-
135
-
136
-
137
-
138
-
139
-
140
-
141
-
142
-
143
-
144
-
145
-
146
-
147
-
148
-
149
-
150
-
151
-
152
-
153
-
154
-
155
-
156
-
157
-
158
-
159
-
160
-
161
-
162
-
163
-
164
-
165
-
166
-
167
-
168
-
169
-
170
-
171
-
172
-
173
-
174
-
175
-
176
-
177
-
178
-
179
-
180
-
181
-
182
-
183
-
184
-
185
-
186
-
187
-
188
-
189
-
190
-
191
-
192
-
193
-
194
-
195
-
196
-
197
-
198
-
199
-
200
-
201
-
202
-
203
-
204
-
205
-
206
-
207
-
208
-
209
-
210
-
211
-
212
-
213
-
214
-
215
-
216
-
217
-
218
-
219
-
220
-
221
-
222
-
223
-
 224
224 -
 225
225 -
 226
226 -
 227
227 -
 228
228 -
 229
229 -
 230
230 -
 231
231 -
 232
232 -
 233
233 -
 234
234 -
 235
235 -
 236
236 -
 237
237 -
 238
238 -
 239
239 -
 240
240 -
 241
241 -
 242
242 -
 243
243 -
 244
244 -
245
-
246
-
247
-
248
-
249
-
250
-
251
-
252
-
253
-
254
-
255
-
256
-
257
-
258
-
259
-
260
-
261
-
262
-
263
-
264
-
265
-
266
-
267
-
268
-
269
-
270
-
271
-
272
-
273
-
274
-
275
-
276
 |
 |

232 Bank of America 2011
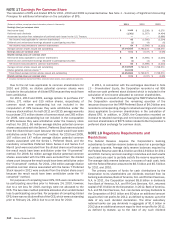
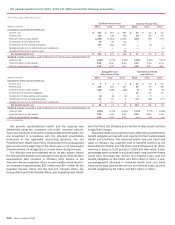
NOTE 17 Earnings Per Common Share
The calculation of EPS and diluted EPS for 2011, 2010 and 2009 is presented below. See Note 1 – Summary of Significant Accounting
Principles for additional information on the calculation of EPS.
(Dollars in millions, except per share information; shares in thousands)
Earnings (loss) per common share
Net income (loss)
Preferred stock dividends
Accelerated accretion from redemption of preferred stock issued to the U.S. Treasury
Net income (loss) applicable to common shareholders
Dividends and undistributed earnings allocated to participating securities
Net income (loss) allocated to common shareholders
Average common shares issued and outstanding
Earnings (loss) per common share
Diluted earnings (loss) per common share
Net income (loss) applicable to common shareholders
Dividends and undistributed earnings allocated to participating securities
Net income (loss) allocated to common shareholders
Average common shares issued and outstanding
Dilutive potential common shares (1)
Total diluted average common shares issued and outstanding
Diluted earnings (loss) per common share
2011
$ 1,446
(1,361)
—
85
(1)
$84
10,142,625
$0.01
$85
(1)
$84
10,142,625
112,199
10,254,824
$0.01
2010
$ (2,238)
(1,357)
—
(3,595)
(4)
$ (3,599)
9,790,472
$(0.37)
$ (3,595)
(4)
$ (3,599)
9,790,472
—
9,790,472
$(0.37)
2009
$ 6,276
(4,494)
(3,986)
(2,204)
(6)
$ (2,210)
7,728,570
$ (0.29)
$ (2,204)
(6)
$ (2,210)
7,728,570
—
7,728,570
$ (0.29)
(1) Includes incremental shares from RSUs, restricted stock shares, stock options and warrants.
Due to the net loss applicable to common shareholders for
2010 and 2009, no dilutive potential common shares were
included in the calculation of diluted EPS because they would have
been antidilutive.
For 2011, 2010 and 2009, average options to purchase 217
million, 271 million and 315 million shares, respectively, of
common stock were outstanding but not included in the
computation of EPS because they were antidilutive under the
treasury stock method. For both 2011 and 2010, average warrants
to purchase 272 million shares of common stock and 265 million
for 2009, were outstanding but not included in the computation
of EPS because they were antidilutive under the treasury stock
method. For 2011, 66 million average dilutive potential common
shares associated with the Series L Preferred Stock were excluded
from the diluted share count because the result would have been
antidilutive under the “if-converted” method. For 2010 and 2009,
107 million and 147 million average dilutive potential common
shares associated with the Series L Preferred Stock, and the
mandatory convertible Preferred Stock Series 2 and Series 3 of
Merrill Lynch were excluded from the diluted share count because
the result would have been antidilutive under the “if-converted”
method. For 2009, 81 million average dilutive potential common
shares associated with the CES were excluded from the diluted
share count because the result would have been antidilutive under
the “if-converted” method. For 2011, 234 million average dilutive
potential common shares associated with the Series T Preferred
Stock issued in 2011 were excluded from the diluted share count
because the result would have been antidilutive under the “if-
converted” method.
For purposes of computing basic EPS, CES were considered to
be participating securities prior to February 24, 2010, however,
due to a net loss for 2010, earnings were not allocated to the
CES. The two-class method prohibits allocation of an undistributed
loss to participating securities. For purposes of computing diluted
EPS, there was no dilutive effect of the CES, which were outstanding
prior to February 24, 2010, due to a net loss for 2010.
In 2011, in connection with the exchanges described in Note
15 – Shareholders’ Equity, the Corporation recorded a net $36
million non-cash preferred stock dividend which is included in the
calculation of net income allocated to common shareholders.
For 2009, as a result of repurchasing the TARP Preferred Stock,
the Corporation accelerated the remaining accretion of the
issuance discount on the TARP Preferred Stock of $4.0 billion and
recorded a corresponding charge to retained earnings and income
(loss) applicable to common shareholders in the calculation of
diluted EPS. In addition, in 2009, the Corporation recorded an
increase to retained earnings and net income (loss) applicable to
common shareholders of $576 million related to the Corporation’s
preferred stock exchange for common stock.
NOTE 18 Regulatory Requirements and
Restrictions
The Federal Reserve requires the Corporation’s banking
subsidiaries to maintain reserve balances based on a percentage
of certain deposits. Average daily reserve balances required by
the Federal Reserve were $14.6 billion and $12.9 billion for 2011
and 2010. Currency and coin residing in branches and cash vaults
(vault cash) are used to partially satisfy the reserve requirement.
The average daily reserve balances, in excess of vault cash, held
with the Federal Reserve amounted to $6.5 billion and $5.5 billion
for 2011 and 2010.
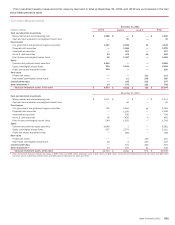
The primary sources of funds for cash distributions by the
Corporation to its shareholders are dividends received from its
banking subsidiaries, Bank of America, N.A. and FIA Card Services,
N.A. In 2011, the Corporation received $9.8 billion in dividends
from Bank of America, N.A. and FIA Card Services, N.A., returned
capital of $7.0 billion to the Corporation. In 2012, Bank of America,
N.A. and FIA Card Services, N.A. can declare and pay dividends to
the Corporation of $4.5 billion and $0 plus an additional amount
equal to their net profits for 2012, as defined by statute, up to the
date of any such dividend declaration. The other subsidiary
national banks can pay dividends in aggregate of $1.0 billion in
2012 plus an additional amount equal to their net profits for 2012,
as defined by statute, up to the date of any such dividend