Bank of America 2011 Annual Report Download - page 124
Download and view the complete annual report
Please find page 124 of the 2011 Bank of America annual report below. You can navigate through the pages in the report by either clicking on the pages listed below, or by using the keyword search tool below to find specific information within the annual report.-
 1
1 -
2
-
3
-
4
-
5
-
6
-
7
-
8
-
9
-
10
-
11
-
12
-
13
-
14
-
15
-
16
-
17
-
18
-
19
-
20
-
21
-
22
-
23
-
24
-
25
-
26
-
27
-
28
-
29
-
30
-
31
-
32
-
33
-
34
-
35
-
36
-
37
-
38
-
39
-
40
-
41
-
42
-
43
-
44
-
45
-
46
-
47
-
48
-
49
-
50
-
51
-
52
-
53
-
54
-
55
-
56
-
57
-
58
-
59
-
60
-
61
-
62
-
63
-
64
-
65
-
66
-
67
-
68
-
69
-
70
-
71
-
72
-
73
-
74
-
75
-
76
-
77
-
78
-
79
-
80
-
81
-
82
-
83
-
84
-
85
-
86
-
87
-
88
-
89
-
90
-
91
-
92
-
93
-
94
-
95
-
96
-
97
-
98
-
99
-
100
-
101
-
102
-
103
-
104
-
105
-
106
-
107
-
108
-
109
-
110
-
111
-
112
-
113
-
 114
114 -
 115
115 -
 116
116 -
 117
117 -
 118
118 -
 119
119 -
 120
120 -
 121
121 -
 122
122 -
 123
123 -
 124
124 -
 125
125 -
 126
126 -
 127
127 -
 128
128 -
 129
129 -
 130
130 -
 131
131 -
 132
132 -
 133
133 -
 134
134 -
135
-
136
-
137
-
138
-
139
-
140
-
141
-
142
-
143
-
144
-
145
-
146
-
147
-
148
-
149
-
150
-
151
-
152
-
153
-
154
-
155
-
156
-
157
-
158
-
159
-
160
-
161
-
162
-
163
-
164
-
165
-
166
-
167
-
168
-
169
-
170
-
171
-
172
-
173
-
174
-
175
-
176
-
177
-
178
-
179
-
180
-
181
-
182
-
183
-
184
-
185
-
186
-
187
-
188
-
189
-
190
-
191
-
192
-
193
-
194
-
195
-
196
-
197
-
198
-
199
-
200
-
201
-
202
-
203
-
204
-
205
-
206
-
207
-
208
-
209
-
210
-
211
-
212
-
213
-
214
-
215
-
216
-
217
-
218
-
219
-
220
-
221
-
222
-
223
-
224
-
225
-
226
-
227
-
228
-
229
-
230
-
231
-
232
-
233
-
234
-
235
-
236
-
237
-
238
-
239
-
240
-
241
-
242
-
243
-
244
-
245
-
246
-
247
-
248
-
249
-
250
-
251
-
252
-
253
-
254
-
255
-
256
-
257
-
258
-
259
-
260
-
261
-
262
-
263
-
264
-
265
-
266
-
267
-
268
-
269
-
270
-
271
-
272
-
273
-
274
-
275
-
276
 |
 |

122 Bank of America 2011
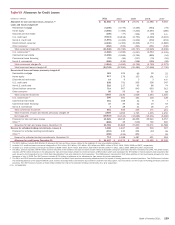
Card Services
Card Services recorded a net loss of $7.0 billion primarily due to
a $10.4 billion goodwill impairment charge. Net interest income
decreased $2.1 billion to $14.4 billion driven by a decrease in
average loans and yields partially offset by lower funding costs.
Noninterest income decreased $348 million to $7.9 billion driven
by lower card income primarily due to the implementation of the
CARD Act partially offset by higher interchange income during 2010
and the gain on the sale of our MasterCard position. The provision
for credit losses improved $15.4 billion to $11.0 billion due to
lower delinquencies and bankruptcies as a result of the improved
economic environment, which resulted in a reduction in the
allowance for credit losses in 2010 compared to an increase in
2009. Noninterest expense increased $9.8 billion to $16.4 billion
primarily due to the goodwill impairment charge.
Consumer Real Estate Services
CRES net loss increased $5.1 billion to a net loss of $8.9 billion
in 2010 primarily due to a $4.9 billion increase in representations
and warranties provision and a $2.0 billion goodwill impairment
charge, partially offset by a decline in the provision for credit losses
driven by improving portfolio trends. Mortgage banking income
declined driven by the increased representations and warranties
provision and lower production volume reflecting a drop in the
overall size of the mortgage market. The provision for credit losses
decreased $2.8 billion to $8.5 billion driven by improving portfolio
trends which led to lower reserve additions, including those
associated with the Countrywide PCI home equity portfolio.
Noninterest expense increased $3.4 billion to $14.9 billion due
to the goodwill impairment charge, higher litigation expense and
an increase in default-related servicing expense, partially offset
by lower production expense and insurance losses.
Global Commercial Banking
Net income increased $1.0 billion to $3.2 billion in 2010. Net
interest income remained relatively flat as growth in average
deposits was offset by a lower net interest income allocation
related to ALM activities. Noninterest income decreased $4.2
billion to $3.2 billion largely due to the 2009 gain of $3.8 billion
related to the contribution of the merchant services business into
a joint venture. The provision for credit losses decreased $5.8
billion to $2.0 billion driven by improvements from stabilizing
values in the commercial real estate portfolio and improved
borrower credit profiles in the U.S. commercial portfolio.
Global Banking & Markets
Net income decreased $1.4 billion to $6.3 billion in 2010 driven
by lower sales and trading revenue due to more favorable market
conditions in 2009, partially offset by credit valuation gains on
derivative liabilities and gains on legacy assets compared to losses
in 2009. Sales and trading revenue was $17.0 billion in 2010
compared to $17.6 billion in 2009 due to increased investor risk
aversion and more favorable market conditions in 2009.
Noninterest expense increased $2.3 billion to $17.5 billion driven
by higher compensation costs as a result of the recognition of
expense on a proportionally larger amount of prior year incentive
deferrals and investments in infrastructure and personnel
associated with further development of the business. Income tax
expense was adversely affected by a charge related to the U.K.
tax rate reduction impacting the carrying value of deferred tax
assets.
Global Wealth & Investment Management
Net income decreased $329 million to $1.3 billion in 2010 driven
by higher noninterest expense and the tax-related effect of the
sale of the Columbia Management long-term asset management
business partially offset by higher noninterest income and lower
credit costs. Net interest income decreased $205 million to $5.7
billion as the positive impact of higher deposit levels was more
than offset by lower revenue from corporate ALM activity.
Noninterest income increased $708 million to $10.6 billion
primarily due to higher asset management fees driven by stronger
markets, continued long-term AUM flows and higher transactional
activity. The provision for credit losses decreased $414 million to
$646 million driven by improving portfolio trends and the
recognition of a single large commercial charge-off in 2009.
Noninterest expense increased $1.1 billion to $13.2 billion due
primarily to higher revenue-related expenses, support costs and
personnel costs associated with further investment in the
business.
All Other
Net income increased $293 million to $1.5 billion in 2010. Net
interest income decreased $1.9 billion to $3.7 billion driven by a
$1.4 billion lower funding differential on certain securitizations
and the impact of capital raises occurring throughout 2009 that
were not allocated to the businesses. Noninterest income
decreased $5.7 billion to $6.0 billion as the prior year included a
$7.3 billion gain resulting from a sale of shares of CCB and an
increase of $1.4 billion on net gains on the sale of debt securities.
This was offset by net negative fair value adjustments related to
our own credit of $4.9 billion on structured liabilities in 2009
compared to a net positive adjustment of $18 million in 2010 and
higher valuation adjustments and gains on sales of select
investments in GPI. Also, in 2010, we sold our investments in Itaú
Unibanco and Santander resulting in a net gain of approximately
$800 million, as well as the gains on CCB and BlackRock. The
provision for credit losses decreased $4.9 billion to $6.3 billion
due to improving portfolio trends in the residential mortgage
portfolio partially offset by further deterioration in the Countrywide
PCI discontinued real estate portfolio.